
Financial data API for US equities.
Spend less time cleaning, more time researching.
14-day money-back guarantee on all plans.
REST API Python client MCP server








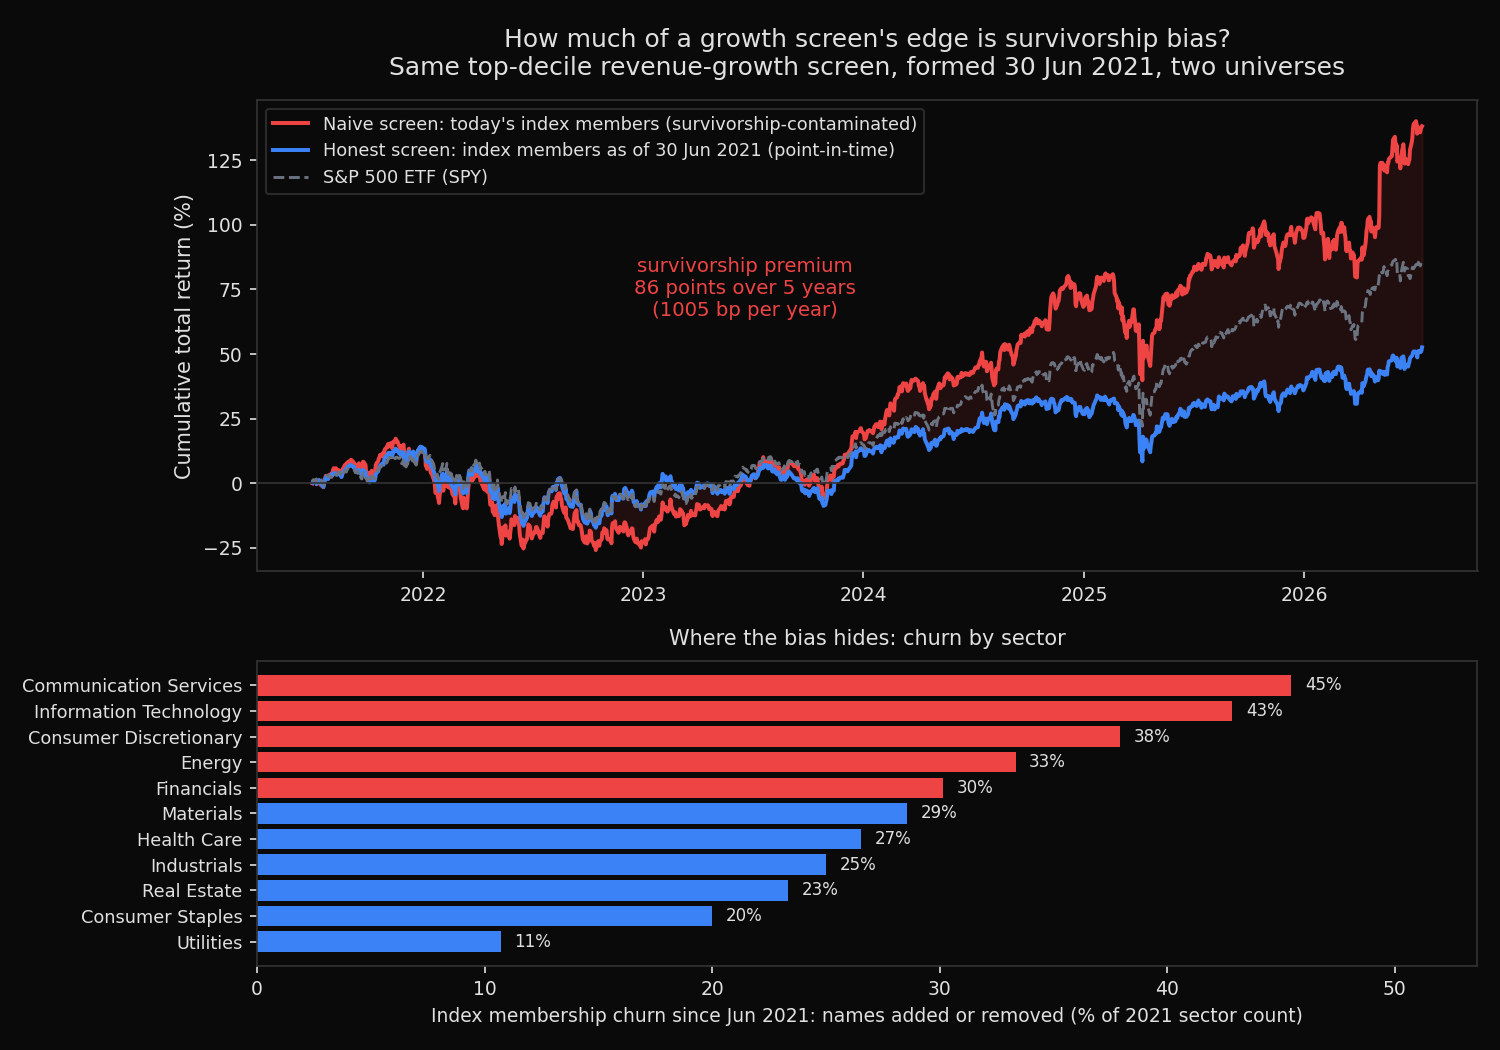
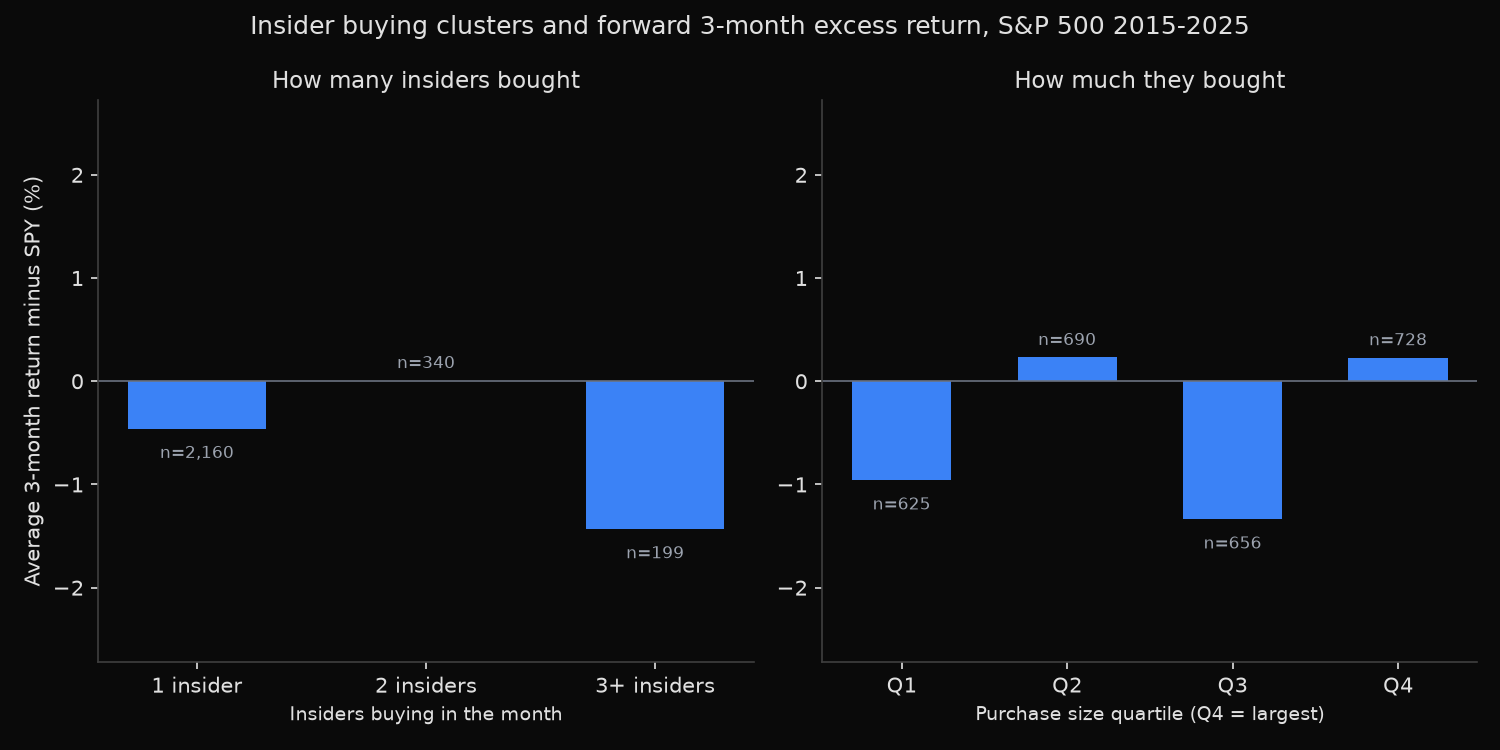
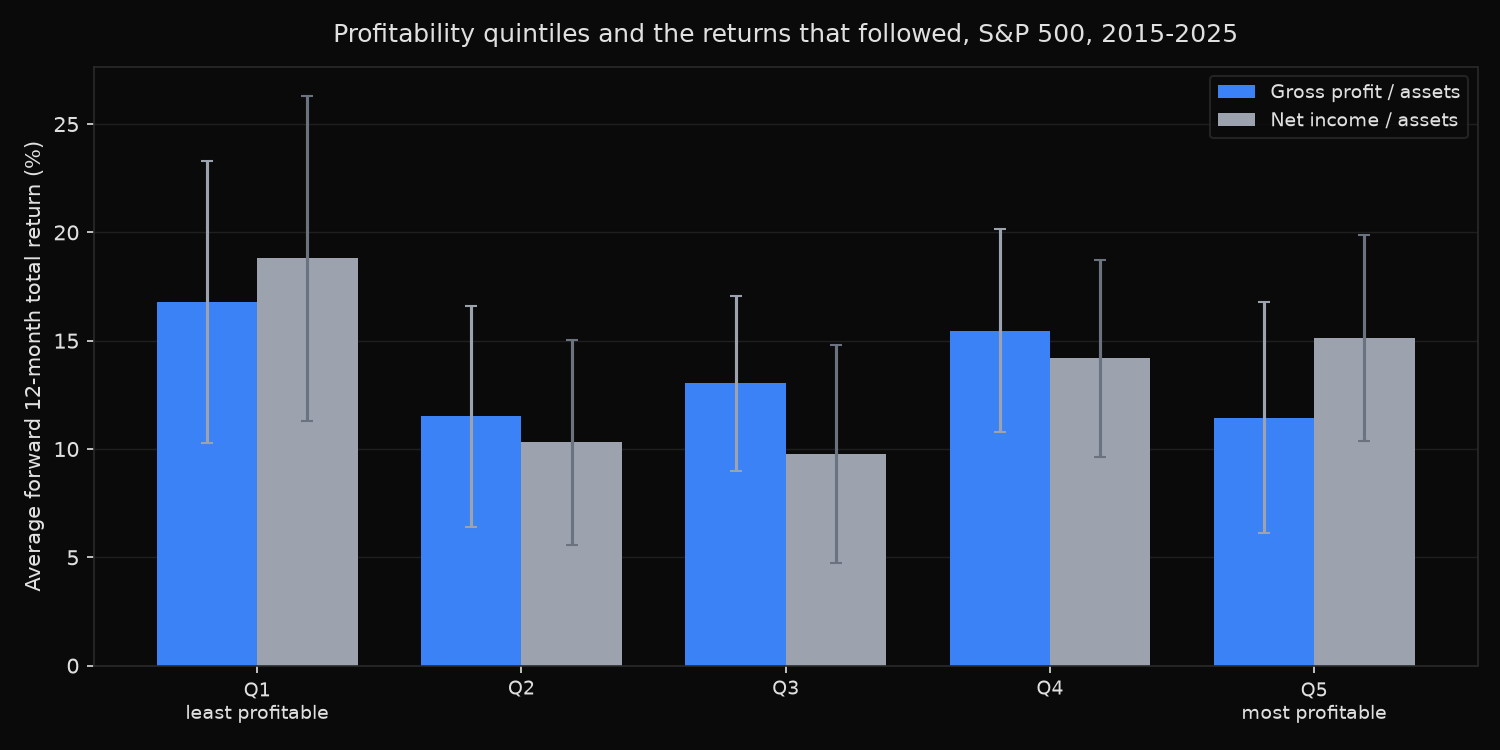
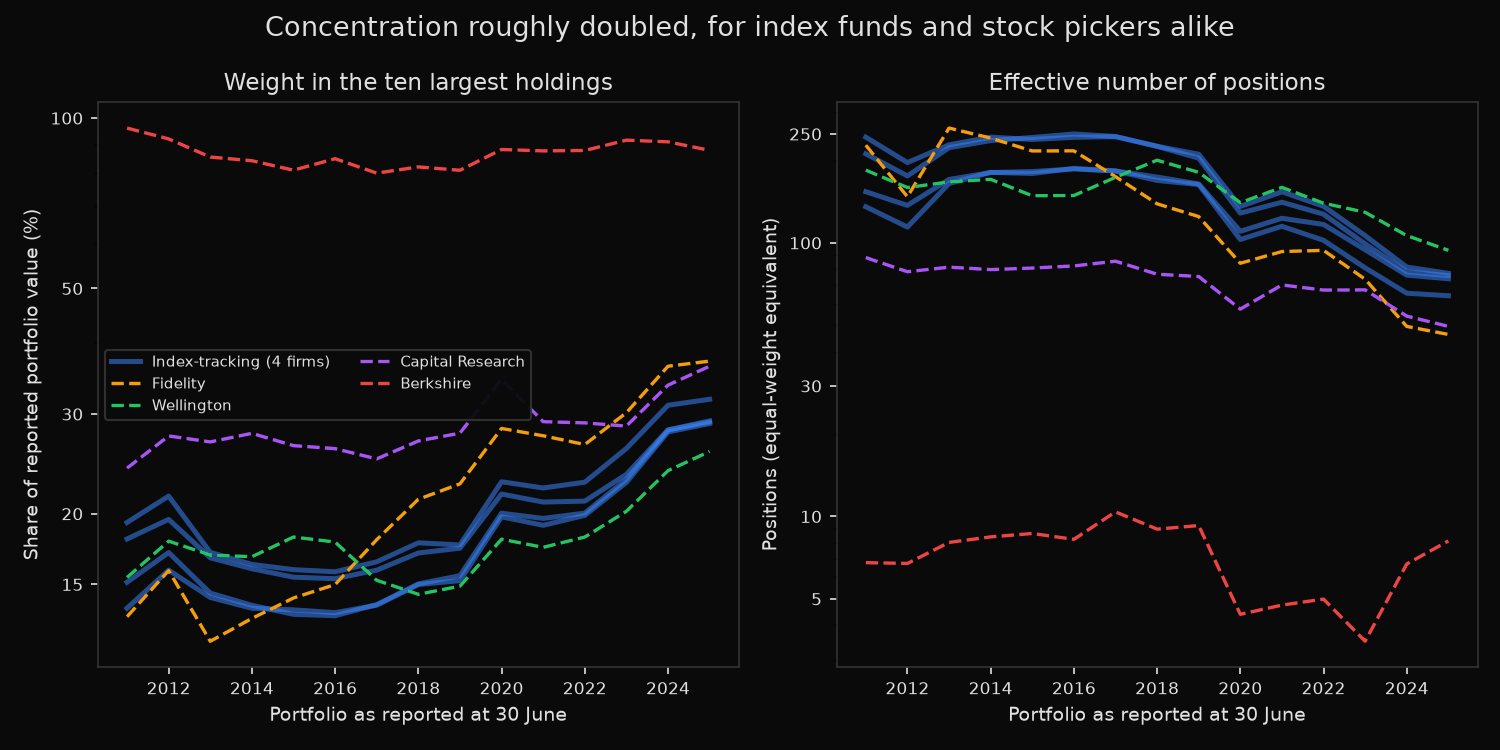
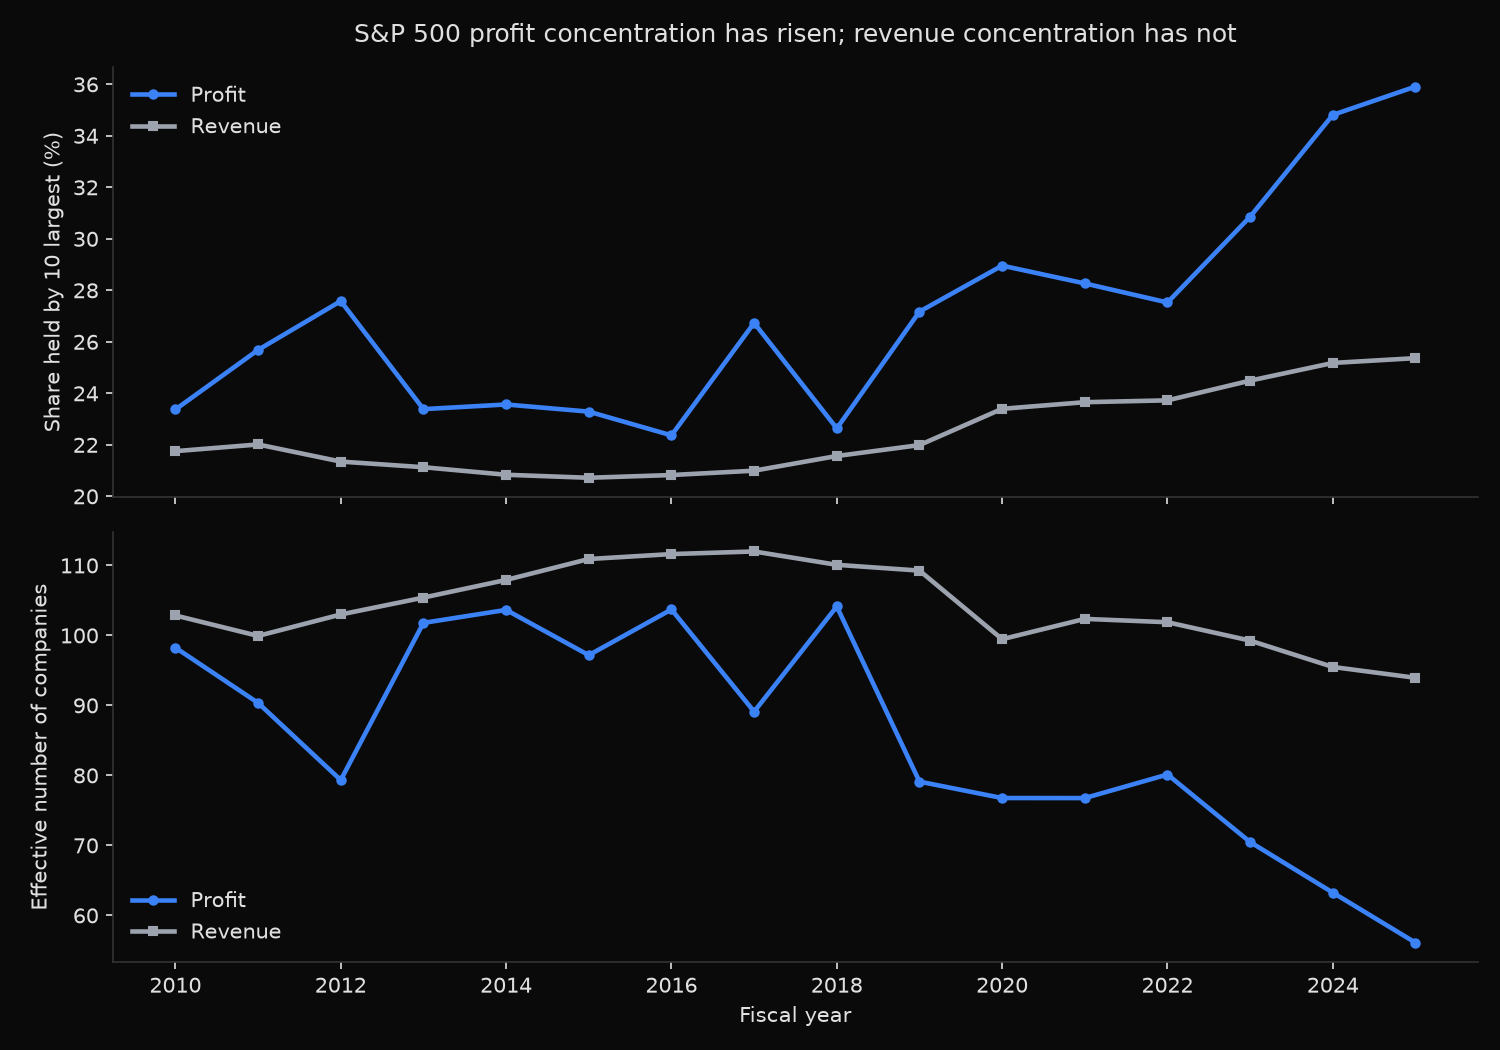
Factor backtests, survivorship-bias studies, insider-signal research, and runnable notebooks live on the blog.
Read in-depth examplesInstall, query, done. Everything you need to integrate xfinlink into a research pipeline, trading system, or weekend project.
Install the package, set your API key, and make your first query in under a minute.
pip install -U xfinlink
Create a free account to get your API key, then:
import xfinlink as xfl

# Set your API key — get a free key at https://xfinlink.com/signup
xfl.set_api_key("YOUR_API_KEY")

# Historical prices
prices = xfl.prices("AAPL", start="2024-01-01")

# Financial statements
fundamentals = xfl.fundamentals("AAPL", period_type="annual")

# Pre-computed metrics (P/E, ROE, margins, ...)
metrics = xfl.metrics("AAPL", fields=["pe_ratio", "roe"])

# Index constituents
sp500 = xfl.index("sp500")

# Search for entities
results = xfl.search(q="apple")

# Entity resolution (handles ticker recycling)
entity = xfl.resolve("GM")
Use an API key via the X-API-Key header for full access (the Python client handles this automatically).
Most API requests require an API key. Create a free account to get yours. Search and resolve allow restricted unauthenticated calls; use a key for normal limits and full detail.
Pass the key via the X-API-Key header:
curl -H "X-API-Key: your-api-key" \
  https://api.xfinlink.com/v1/prices/AAPL?start=2024-01-01
The Python client handles auth automatically:
import xfinlink as xfl

# Set your API key — get a free key at https://xfinlink.com/signup
xfl.set_api_key("YOUR_API_KEY")
Your API key is shown on the dashboard after sign-up. You can regenerate it at any time.
Daily OHLCV prices with split adjustment, total returns, and dividend/split event data.
| param | type | default | description |
|---|---|---|---|
| ticker | str | list[str] | required | Ticker(s) to fetch. |
| start | str (ISO date) | optional | Earliest date, inclusive. |
| end | str (ISO date) | optional | Latest date, inclusive. Defaults to today. |
| fields | list[str] | optional | Subset of columns. Defaults to 11 fields; market_cap is opt-in. |
| adjust | str | "split" | Adjustment mode: split (default) or none. |
Request:
df = xfl.prices("AAPL", start="2024-01-01", fields=["close", "volume"])
Response:
  date        ticker   close      volume
  2024-01-02  AAPL     185.64  45,123,456
  2024-01-03  AAPL     184.25  42,889,012
  2024-01-04  AAPL     181.91  49,301,234
  ...
Reported financials — income statement, balance sheet, cash flow — for most listed US companies.
| param | type | default | description |
|---|---|---|---|
| ticker | str | list[str] | required | Ticker(s) to fetch. |
| period_type | str | "all" | "annual" | "quarterly" | "all" |
| fields | list[str] | optional | Subset of available fields. |
| include | str | optional | "segments" — adds revenue breakdowns by geography, product, and business segment. |
| segment_members | str | "primary" | "primary" or "all". Primary returns segments summing to revenue; all includes subtotals. |
| start | str (ISO date) | optional | Earliest period_end. |
| end | str (ISO date) | optional | Latest period_end. |
| fiscal_year | int | optional | Exact-match filter on fiscal_year. |
| period_end | str (ISO date) | optional | Exact-match filter on period_end. |
df = xfl.fundamentals("AAPL", period_type="annual",
                  fields=["revenue", "net_income"])
Full entity history for a ticker. Every company that ever used this ticker, with validity dates, classifications, and index membership.
| param | type | default | description |
|---|---|---|---|
| ticker | str | required | Ticker symbol or comma-separated tickers (up to 10). |
| include | str | optional | index, classifications |
info = xfl.resolve("GM")
for entity in info["data"]["GM"]["entities"]:
    print(entity["name"], entity["ticker_valid_from"], entity["ticker_valid_to"])
Discover entities by name, sector, type, or classification code.
| param | type | default | description |
|---|---|---|---|
| q | str | optional | Fuzzy search on name or ticker. |
| gics_sector | str | optional | Filter by GICS sector name. |
| entity_type | str | optional | Filter by entity type (corporation, etc.). |
| sic | str | optional | Filter by SIC code. |
| naics | str | optional | Filter by NAICS code. |
| country | str | US | Country filter. |
| limit | int | 50 | Results per page (max 500). |
| offset | int | 0 | Pagination offset. |
df = xfl.search(gics_sector="Consumer Staples")
df = xfl.search(q="apple")
Current and historical index constituents. Available indices: sp500, ndx100, djia, russell2000.
| param | type | default | description |
|---|---|---|---|
| index_name | str | sp500 | Index name (path parameter). |
| as_of | str (ISO date) | today | Point-in-time membership date. |
| limit | int | 500 | Results per page (max 1000). |
| offset | int | 0 | Pagination offset. |
df = xfl.index("sp500")
df = xfl.index("sp500", as_of="2020-01-01")
Insider transactions from SEC Form 3, 4, and 5 filings. One row per transaction. Shares and prices are split-adjusted. Coverage 1996 to present. Available on all paid plans (Pro and above); free-tier keys receive 402.
| param | type | default | description |
|---|---|---|---|
| ticker | str | required | Ticker or comma-separated tickers (up to 100). |
| start | str (ISO date) | 1y ago | Earliest transaction_date. |
| end | str (ISO date) | optional | Latest transaction_date. |
| transaction_type | str | optional | Decoded type, e.g. open_market_buy, open_market_sell, grant_or_award, option_exercise, tax_withholding, gift. Comma-separated for multiple. |
| acquisition_or_disposition | str | optional | "A" or "D". |
| ownership_type | str | optional | "direct" or "indirect". |
| form_type | str | optional | "3", "4", "5" (or amended e.g. "4/A"). |
| insider_role | str | optional | Substring match on role (CEO, CFO, Director, etc.). |
| insider_name | str | optional | Substring match on name. |
| min_value | num | optional | Minimum transaction_value in dollars. |
| include_amendments | bool | false | Include amendment rows. |
| limit | int | 1000 | Rows per page, max 5000. |
Fields returned: entity_id, ticker, entity_name, transaction_date, filing_date, form_type, insider_name, insider_role, insider_role_other, transaction_code, transaction_type, acquisition_or_disposition, shares, shares_held_after, transaction_price, transaction_value, ownership_type, is_amendment, document_id, sequence_in_filing, data_quality.
df = xfl.insiders("TSLA", transaction_type="open_market_sell", insider_role="CEO")
Pre-computed financial metrics across multiple categories — valuation, profitability, leverage, liquidity, efficiency, per-share, dividends, financial scores, and growth. All ratios as decimals (0.46 = 46%). Market cap and enterprise value in millions USD. Per-share values in dollars.
| param | type | default | description |
|---|---|---|---|
| ticker | str | required | Ticker or comma-separated tickers. |
| period_type | str | annual | annual or quarterly. |
| fields | str | all | Comma-separated metric names. |
| start | str (ISO date) | optional | Start date for period_end. |
| end | str (ISO date) | optional | End date for period_end. |
| limit | int | 20 | Rows per page. |
Valuation: market_cap, market_cap_diluted, enterprise_value, pe_ratio, ps_ratio, pb_ratio, price_to_cash_flow, ev_ebitda, earnings_yield, dividend_yield
Profitability: gross_margin, operating_margin, net_margin, ebitda_margin, roe, roa, roic
Leverage: debt_to_equity, debt_to_assets, long_term_debt_to_equity, long_term_debt_to_assets, current_ratio, quick_ratio, interest_coverage
Efficiency: asset_turnover, inventory_turnover
Per-share ($/share): revenue_per_share, book_value_per_share, tangible_book_value_per_share, cash_per_share, debt_per_share, ocf_per_share, fcf_per_share, ebit_per_share, ebitda_per_share, capex_per_share, working_capital_per_share
df = xfl.metrics("AAPL", fields=["pe_ratio", "roe", "market_cap"])
Data fields across every endpoint. See the Explorer on the home page for live values.
INCOME STATEMENT (38)
BALANCE SHEET — ASSETS (22)
BALANCE SHEET — LIABILITIES (19)
BALANCE SHEET — EQUITY (10)
CASH FLOW (33)
SHARES & CLASSIFICATION (7)
INDUSTRY — BANKING (9) • INSURANCE (5) • REIT (3)
xfinlink follows the academic convention for price data. This matters for backtesting and returns analysis.
| field | description |
|---|---|
| close | Raw unadjusted closing price — what actually traded on the exchange that day. |
| adj_close | Split-only adjusted close. Adjusted for stock splits but NOT for dividends. Comparable across split events. |
| return_daily | Total daily return including dividends. Use this for performance analysis and backtesting. |
| dividend | Cash dividend amount on ex-date. Zero on non-dividend days. |
| split_ratio | Split ratio on split date (e.g., 4.0 for a 4:1 split). 1.0 on non-split days. |
Adjustment direction: adj_close is split-only backward-adjusted to the current post-split share basis. To derive a forward-adjusted series from an anchor date, request raw close plus split_ratio, then compound split ratios forward.
import xfinlink as xfl

df = xfl.prices("AAPL", start="2020-08-27", end="2020-09-02", fields=["close", "split_ratio"], adjust="none")
df = df.sort_values("date")

factor = df["split_ratio"].fillna(1.0).cumprod()
df["forward_adj_close"] = df["close"] * factor
date        ticker  close      split_ratio  forward_adj_close
2020-08-27  AAPL    500.04001  NaN          500.04001
2020-08-28  AAPL    499.23001  NaN          499.23001
2020-08-31  AAPL    129.03999  4.0          516.15996
2020-09-01  AAPL    134.17999  NaN          536.71996
2020-09-02  AAPL    131.39999  NaN          525.59996
Why no dividend-adjusted prices? Dividend-adjusted prices retroactively change every time a company pays a dividend, making historical values unstable. xfinlink stores stable values (split-only adjusted) plus total returns, which is the academic standard for quantitative research.
How to compute dividend-adjusted prices client-side:
import xfinlink as xfl

df = xfl.prices("AAPL", start="2020-01-01", fields=["adj_close", "return_daily"])

# Build cumulative total return index
df["total_return_index"] = (1 + df["return_daily"]).cumprod()

# Derive dividend-adjusted price series
df["div_adj_close"] = df["adj_close"].iloc[-1] * df["total_return_index"] / df["total_return_index"].iloc[-1]
Price fields and fundamentals fields are on different split-adjustment bases.
adj_close is split-only adjusted (no dividend adjustment). All fundamentals per-share fields (eps_diluted, dividends_per_share) are as-reported with no split adjustment. Do not combine them for ratios (P/E, P/B, etc.) unless no split occurred between the reporting date and today.
import xfinlink as xfl

df = xfl.fundamentals(
    ["AAPL", "MSFT", "GOOGL"],
    period_type="annual",
    fields=["revenue", "net_income", "operating_cash_flow"],
    start="2024-01-01",
)
print(df[["ticker", "period_end", "revenue", "net_income"]])
import xfinlink as xfl

df = xfl.prices("AAPL", start="2024-01-01", end="2024-12-31")
df["cumulative_return"] = (1 + df["return_daily"]).cumprod() - 1
print(f"AAPL 2024 total return: {df['cumulative_return'].iloc[-1]:.1%}")
import xfinlink as xfl

info = xfl.resolve("GM")
for entity in info["data"]["GM"]["entities"]:
    print(f"{entity['name']}: {entity['ticker_valid_from']} → {entity['ticker_valid_to']}")
# General Motors Corporation (pre-2009 bankruptcy): 1962-07-02 → 2009-06-01
# General Motors Company: None → None (current)
For developers with Python + IDE
pip install -U xfinlinkLoading llms.txt…
Zero code — ask questions, get answers
Server URL
https://api.xfinlink.com/mcp?api_key=YOUR_API_KEY
Replace YOUR_API_KEY with your key from the dashboard.
Available tools: get_prices, get_fundamentals, get_metrics, resolve_ticker, search, get_index, get_index_events, get_insiders, get_holdings, get_manager_holdings, search_managers
Option A — Web (claude.ai)
xfinlink, URL: https://api.xfinlink.com/mcp?api_key=YOUR_API_KEYAvailable on Free (1 connector), Pro, Max, Team, and Enterprise plans.
Option B — Claude Desktop
claude_desktop_config.json:{
"mcpServers": {
"xfinlink": {
"command": "npx",
"args": ["-y", "mcp-remote", "https://api.xfinlink.com/mcp?api_key=YOUR_API_KEY"]
}
}
}Requires Plus, Pro, Team, Enterprise, or Edu plan.
xfinlink, MCP server URL: https://api.xfinlink.com/mcp?api_key=YOUR_API_KEY, Authentication: NoneOption A — Web (grok.com)
Requires a paid Grok account.
xfinlink, URL: https://api.xfinlink.com/mcp?api_key=YOUR_API_KEYOption B — xAI API (Developer)
from openai import OpenAI

client = OpenAI(
    api_key="your-xai-api-key",
    base_url="https://api.x.ai/v1",
)

response = client.responses.create(
    model="grok-4.20-reasoning",
    input=[{"role": "user", "content": "What's AAPL's quarterly revenue trend?"}],
    tools=[{
        "type": "mcp",
        "server_url": "https://api.xfinlink.com/mcp?api_key=YOUR_API_KEY",
        "server_label": "xfinlink",
    }],
)
Requires Pro, Max, or Enterprise plan.
xfinlink, MCP Server URL: https://api.xfinlink.com/mcp?api_key=YOUR_API_KEY, Authentication: None, Transport: Streamable HTTPAdd to .cursor/mcp.json:
{
  "mcpServers": {
    "xfinlink": {
      "url": "https://api.xfinlink.com/mcp?api_key=YOUR_API_KEY"
    }
  }
}API key request limits: Free: 100/day, Pro: 10,000/day, Max: 50,000/day, Redistribution: 500,000/day.
Sign up to get your API key. View pricing for higher limits.
We read everything.
Questions, partnerships, or just want to say hi.
hello@xfinlink.com • BUGSFound a bug or want a new data field? Send us an email.
hello@xfinlink.com • PLANSNeed more throughput or the right to show our data to your end users? The Max and Redistribution plans scale you up. Custom needs — email hello@xfinlink.com.
View plans →Data field missing? Endpoint slow? Something broken? Tell us — we prioritize by demand.