BLOG

Behind the numbers.

Code examples, market analysis, and data quality deep-dives.

Is MSTR a Leveraged Bitcoin Proxy? Rolling Beta Analysis in Python
Is Micron's Memory Cycle Recovering? Inventory and Margin Forecasting in Python
Which Sectors Work When Bonds Rally? Rate-Sensitive Rotation in Python
Do One-Month Price Extremes Reverse? Signal Evaluation in Python
Do Low-Volatility S&P 500 Stocks Reduce Drawdowns? Factor Test in Python
Is AI Capex Paying Back Fast Enough? Revenue Hurdle Forecasting in Python
Could Shorter AI Asset Lives Hit Earnings? Depreciation Stress Test in Python
How Much AI Capex Risk Can a Portfolio Remove? Constrained Optimization in Python
Is the AI Capex Trade Crowded? Rolling Volatility and Sector Rotation in Python
Did the AI Boom Come From Existing S&P 500 Members? Point-in-Time Momentum Test in Python
Is AI Revenue Circular? Customer-Vendor Capex Loop Analysis in Python
Is the AI Trade Connected to Private Credit? Rolling Correlation Network in Python
Is Apollo More Balance-Sheet Sensitive Than Peers? Leverage Screen in Python
Are AI Earnings Supported by Cash Flow? Accrual and Capex Screen in Python
Can Defensive Stocks Hedge AI Drawdowns? Basket Regime Test in Python
How Fast Does the Market Price In Fed Decisions? FOMC Event Study in Python
How Much Are Options Sellers Overpaid? The Variance Risk Premium in Python
Which Companies Have the Worst Earnings Quality? Sloan Accrual Screen with Geographic Revenue Data in Python
Does the Oil-to-Gold Ratio Signal Recessions? XLE/GLD Backtest in Python
Is AI Spending Crowding Out Free Cash Flow? Capex Sustainability Across the Mag 7 in Python
Does a Long Energy / Short Bonds Portfolio Capture Inflation Surprises? Factor Construction in Python
Can a Hidden Markov Model Detect Oil Market Regimes? HMM Analysis in Python
Do Grain Prices Predict Food Inflation? Granger Causality Test in Python
Does the Corporate Credit Spread Predict Stock Market Crashes? BAA-AAA Spread Analysis in Python
Do Oil Stocks Hedge Inflation? Rolling Beta Analysis in Python
Which Stocks Are Most Rate-Sensitive? Equity Duration via Bond Beta in Python
Which Companies Have the Highest Accrual Ratios? Earnings Quality Screening in Python
Is Alpha Persistent or Decaying? Rolling Sharpe Ratio Analysis in Python
Are Markets Trending or Mean-Reverting? Hurst Exponent Analysis in Python
Is Consumer Discretionary vs Staples a Leading Indicator? XLY/XLP Ratio Analysis in Python
Does Heavy Capex Predict Future Stock Returns? Capital Expenditure Analysis in Python
How to Estimate Cost of Equity Using CAPM in Python
Is Volatility Predictable? Testing for Volatility Clustering in Python
Which Industrials Are Overleveraged? Net Debt to EBITDA Screening in Python
GM Before and After Bankruptcy: Why Entity Resolution Matters for Financial Data
What Is Adjusted Beta? Merrill Lynch Beta Shrinkage in Python
How Good Is a Stock Pick? Information Ratio and Tracking Error in Python
Do Stock Returns Follow a Normal Distribution? Testing for Fat Tails in Python
Which Large Caps Have the Highest Free Cash Flow Yield? FCF Screening in Python
Which Sectors Won Over 5 Years? Sector Rotation Analysis in Python
How to Forecast Stock Volatility with GARCH Models in Python
Are Stock Prices Mean-Reverting? Augmented Dickey-Fuller Test in Python
How to Calculate CAPM Alpha and Beta with Regression in Python
How to Compare Sector Sharpe Ratios and Sortino Ratios in Python
DELL: Why Stitching Historical Price Data Together Is Wrong
How to Analyze Drawdown and Recovery for Bank Stocks in Python
How to Screen SaaS Stocks by Revenue Growth and Cash Flow in Python
How to Screen REITs by Dividend Yield and Valuation in Python
How Correlated Are the Magnificent 7? Intra-Group Correlation in Python
AAPL vs XOM: Do Individual Stocks Have Seasonal Patterns?
How to Rank Large-Cap Stocks by Momentum in Python
How to Build a Multi-Endpoint Financial Dashboard in Python
How to Compare Volatility Across Energy Stocks in Python
How to Screen Healthcare Stocks by Valuation in Python
How to Build a Sector Correlation Matrix for Portfolio Diversification in Python
How to Find Oversold and Overbought Stocks Using Z-Scores in Python
How to Measure Earnings Quality: Cash Flow vs Net Income in Python
How to Build a Multi-Factor Stock Screen in Python (Value + Momentum + Quality)
How to Build a Simple DCF Model for Any Stock in Python
How to Screen Tech Stocks by Revenue Growth in Python
How to Screen Stocks by Balance Sheet Health in Python
Is "Sell in May" Real? SPY Monthly Seasonality Over 10 Years
How to Compare Sector Performance YTD Using Python
How to Track S&P 500 Additions and Removals Over Time in Python
How to Screen Dividend Stocks by Yield and Quality in Python
How to Calculate Max Drawdown and Recovery Time for Any Stock in Python
How to Compare Profitability Across Mega-Cap Tech Stocks in Python
Why Ticker Symbols Are Unreliable: The Recycling Problem Every Quant Should Know
How to Calculate and Compare Stock Volatility in Python
How to Screen Blue-Chip Stocks by P/E Ratio in Python
How to Track Companies Through Ticker Changes, Bankruptcies, and Renames in Python
S&P 500 Turnover: How Much the Index Has Changed Since 2010
How to Calculate Stock Beta and Correlation in Python
← All articles

Is MSTR a Leveraged Bitcoin Proxy? Rolling Beta Analysis in Python

What's the question?

MicroStrategy, now trading as MSTR, is often treated as an equity wrapper for Bitcoin exposure. That framing is useful, but incomplete. An equity can move with Bitcoin and still carry additional risk from leverage, operating-company structure, financing, index flows, and investor positioning.

The practical question is whether MSTR behaves like a one-for-one Bitcoin proxy or like a leveraged exposure. Beta answers that question. Beta measures the sensitivity of one return series to another. A beta of 1.50 to IBIT means that, historically, MSTR moved about 1.5% for every 1.0% move in IBIT, before considering company-specific noise.

This matters for position sizing. If a portfolio manager treats MSTR as ordinary equity exposure, the portfolio may contain more Bitcoin-linked risk than intended.

The approach

The test compares MSTR with IBIT, COIN, MARA, and RIOT from January 11, 2024, the start of IBIT trading history in the data. Built from SEC EDGAR public filings and market data, the analysis uses daily split-adjusted prices.

  1. Pull daily prices for the Bitcoin-linked basket
  2. Calculate daily returns from adj_close
  3. Estimate full-sample beta and correlation to IBIT
  4. Calculate rolling 60-day beta and correlation for MSTR
  5. Compare annualized volatility and max drawdown across the basket

The benchmark is IBIT because it is the cleanest listed Bitcoin-linked reference in the sample. COIN, MARA, and RIOT provide an equity peer group.

Code

import xfinlink as xfl
import pandas as pd

xfl.set_api_key("YOUR_API_KEY")  # free at https://xfinlink.com/signup

tickers = ["MSTR", "IBIT", "COIN", "MARA", "RIOT"]
df = xfl.prices(tickers, start="2024-01-11", fields=["adj_close"])
prices = df.pivot_table(index="date", columns="ticker", values="adj_close")[tickers].dropna()
returns = prices.pct_change(fill_method=None).dropna()

stats = []
for ticker in tickers:
    beta = returns[ticker].cov(returns["IBIT"]) / returns["IBIT"].var()
    corr = returns[ticker].corr(returns["IBIT"])
    vol = returns[ticker].std() * (252 ** 0.5)
    drawdown = (prices[ticker] / prices[ticker].cummax() - 1).min()
    stats.append([ticker, beta, corr, vol, drawdown])

print(pd.DataFrame(stats, columns=["ticker", "beta", "corr", "vol", "max_drawdown"]))

Full script with formatting and visualisation: mstr-bitcoin-proxy-beta-python.py

Output

MSTR beta and cumulative return compared with IBIT and Bitcoin-linked equities
=== MSTR Bitcoin-Proxy Beta Test ===
Sample: 2024-01-12 to 2026-06-04 (599 trading days)
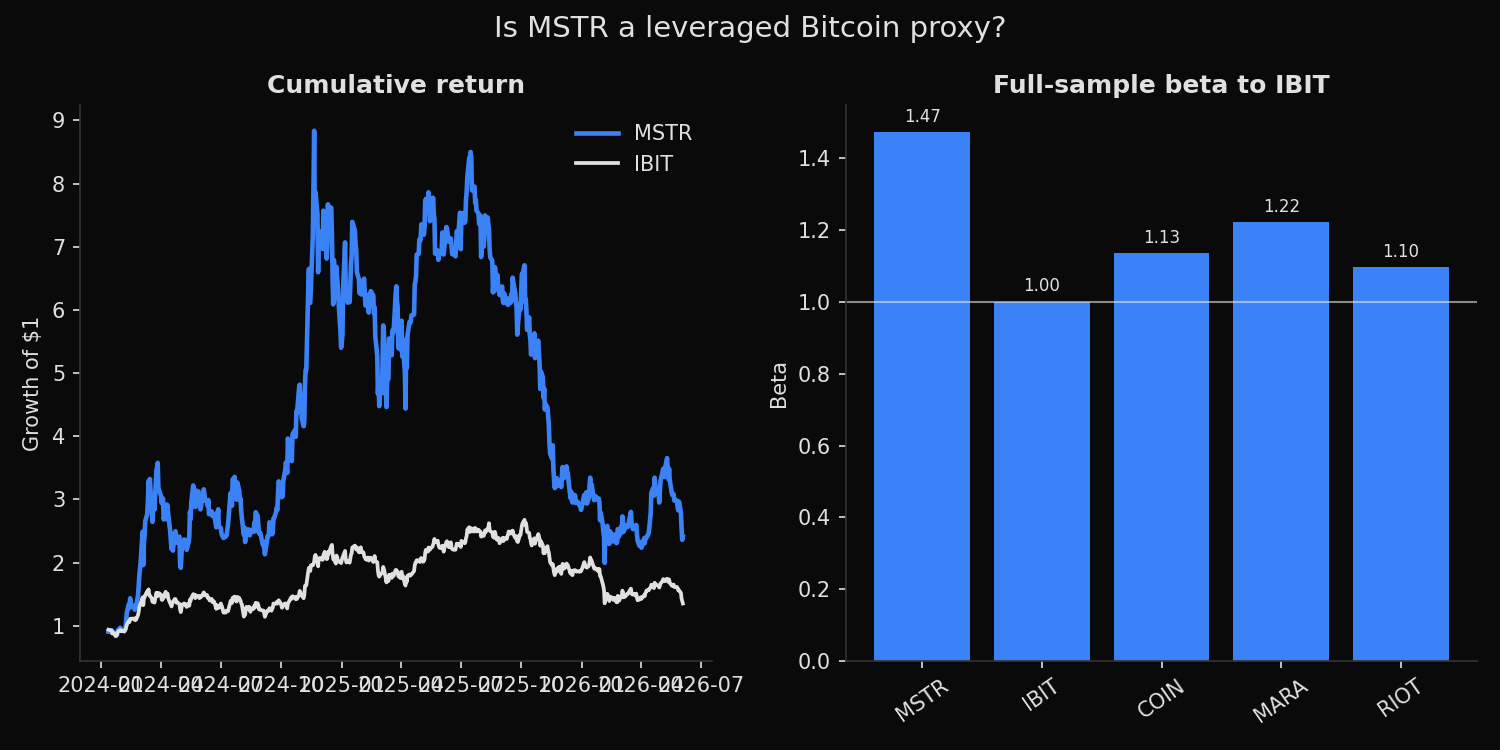
MSTR full-sample beta to IBIT:        1.47
MSTR latest 60-day beta to IBIT:     1.66
MSTR full-sample correlation:        0.79
MSTR latest 60-day correlation:      0.84
MSTR annualized volatility:            93.3%
IBIT annualized volatility:            50.3%
MSTR max drawdown:                    -77.4%
IBIT max drawdown:                    -49.5%
MSTR up-capture on IBIT +3% days:    1.52x
MSTR down-capture on IBIT -3% days:  1.34x

Bitcoin-linked equity ranking:
MSTR  beta= 1.47  corr=0.79  vol=  93.3%  max_drawdown= -77.4%
MARA  beta= 1.22  corr=0.66  vol=  92.4%  max_drawdown= -78.3%
COIN  beta= 1.13  corr=0.72  vol=  79.5%  max_drawdown= -66.4%
RIOT  beta= 1.10  corr=0.62  vol=  89.0%  max_drawdown= -64.3%
IBIT  beta= 1.00  corr=1.00  vol=  50.3%  max_drawdown= -49.5%

What this tells us

MSTR behaves like a leveraged Bitcoin-linked equity, not a one-for-one Bitcoin proxy. Its full-sample beta to IBIT is 1.47, and the latest 60-day beta is higher at 1.66. Correlation is also high. The full-sample correlation is 0.79, while the latest 60-day correlation is 0.84.

The risk difference is visible in volatility and drawdown. MSTR annualized volatility is 93.3%, compared with 50.3% for IBIT. MSTR max drawdown is -77.4%, compared with -49.5% for IBIT. The down-capture ratio is 1.34x on days when IBIT falls at least 3%, which means MSTR has historically amplified large downside Bitcoin moves.

MSTR also has the highest beta in the peer group. MARA, COIN, and RIOT all have positive Bitcoin sensitivity, but none exceed MSTR on this measure.

So what?

MSTR should be sized as leveraged Bitcoin-linked exposure. A 5% position in MSTR is not economically similar to a 5% position in IBIT. Based on this sample, its beta-adjusted Bitcoin exposure is closer to 7% to 8%, and the drawdown profile is materially worse.

For portfolio construction, the useful control is not the ticker label. It is the estimated beta and down-capture ratio. If those measures keep rising, MSTR becomes less useful as a diversified equity holding and more useful only as an explicit high-conviction Bitcoin risk position.

Built with xfinlink — free financial data API for Python. pip install xfinlink

Built with xfinlink — free financial data API for Python. pip install xfinlink
← All articles