
How Much of a Stock's Return Comes From Its Sector? Variance Decomposition in Python
August 9, 2026
What’s the question?
Sector labels carry a lot of weight in practice. Risk models neutralise on them, long-short books are balanced sector by sector, and any comparison of two companies starts by checking both sit in the same one. All of it rests on a rarely stated quantity: how much of what a stock does in a month is a sector event rather than a company event.
A monthly return splits into three parts that do not overlap: what every stock did together, which is the market; what the stock’s sector did beyond that, which is the sector effect; and whatever remains, which is stock-specific. The split is arithmetic rather than a fitted model, so the parts add back to the original return exactly. Their relative sizes are the open question.
The answer changes what a portfolio should look like. A large sector share would mean a sector-neutral book has already shed most of the risk a stock picker never intended to hold. A small one would mean sector neutrality is largely presentational.
The approach
The cross-section has to be the index as it actually stood in each month. Running today’s members backwards keeps only the companies that survived, and survivors are the names whose company-specific risk happened to pay off.
- Rebuild the S&P 500 roster at the end of each year from 2015 through 2025, and hold each roster for the calendar year that follows. A company removed during 2019 sits in the 2016 through 2019 cross-sections and is absent from 2020 onward.
- Pull monthly prices for all 691 companies that held membership at any point, keyed on the company identifier rather than the ticker string, so a symbol change keeps one continuous series.
- Compute returns from split-adjusted month-end closes, then clip each month’s cross-section at its own 1st and 99th percentiles. Variance estimates are sensitive to their tails; a 0.5% clip is reported alongside as a check.
- In each month, take the equal-weighted mean across members as the market effect, each sector’s mean minus that as the sector effect, and the remainder as each company’s stock-specific return.
- Pool the 62,045 company-months and compare the variance of the three parts.
Equal weighting is deliberate: the question concerns a typical member, and a cap-weighted mean over this period is mostly a statement about six companies.
Code
import numpy as np
import pandas as pd
import xfinlink as xfl

xfl.set_api_key("YOUR_API_KEY")  # free at https://xfinlink.com/signup

rosters = {y: xfl.index("sp500", as_of=f"{y-1}-12-31") for y in range(2016, 2027)}
members = {y: set(r["entity_id"].dropna().astype(int)) for y, r in rosters.items()}
ids = sorted(set().union(*members.values()))

CHUNK = 100
px = pd.concat([
    xfl.prices(entity_id=ids[i:i + CHUNK], start="2015-12-01", end="2026-07-31",
               interval="1mo", fields=["date", "close", "adj_close", "gics_sector"],
               max_rows=50000)
    for i in range(0, len(ids), CHUNK)], ignore_index=True)

px["month"] = px["date"].dt.to_period("M")
sector = px.dropna(subset=["gics_sector"]).groupby("entity_id")["gics_sector"].last()
panel = px.pivot_table(index="month", columns="entity_id", values="adj_close")
ret = (panel / panel.shift(1) - 1).loc[pd.Period("2016-01"):]

rows = []
for m in ret.index:
    r = ret.loc[m].dropna()
    r = r[[i for i in r.index if i in members[m.year] and i in sector.index]]
    if len(r) < 100:
        continue
    r = r.clip(r.quantile(0.01), r.quantile(0.99))
    s = sector.reindex(r.index)
    mkt = r.mean()                               # market effect
    sec_dev = s.map(r.groupby(s).mean()) - mkt   # sector effect, net of market
    idio = r - mkt - sec_dev                     # stock-specific
    rows.append((len(r), mkt, sec_dev, idio,
                 1 - (idio ** 2).sum() / ((r - mkt) ** 2).sum()))

m = np.concatenate([np.full(n, k) for n, k, _, _, _ in rows])
s = np.concatenate([d.values for _, _, d, _, _ in rows])
e = np.concatenate([d.values for _, _, _, d, _ in rows])
v = (m + s + e).var()
print(f"market {100*m.var()/v:.1f}%  sector {100*s.var()/v:.1f}%  stock {100*e.var()/v:.1f}%")
Full script with formatting and visualisation: how-much-of-stock-return-is-sector-python.py
Output
691 companies held S&P 500 membership at some point, 2016-2026
127 months, 62,045 company-month returns, 489 companies per month on average

share of a company's monthly return variance
  market (all stocks together)  29.6%
  sector (net of the market)    13.1%
  stock-specific                57.3%
  monthly standard deviation of the typical return: 8.82%
  same three shares at a 0.5% winsor: 28.6% / 13.0% / 58.4%

monthly standard deviation after hedging
  unhedged                 8.82%
  market hedged            7.40%  (16.1% lower)
  market + sector hedged   6.67%  (9.8% lower again)

sector share of the within-month cross-section (R-squared of sector dummies)
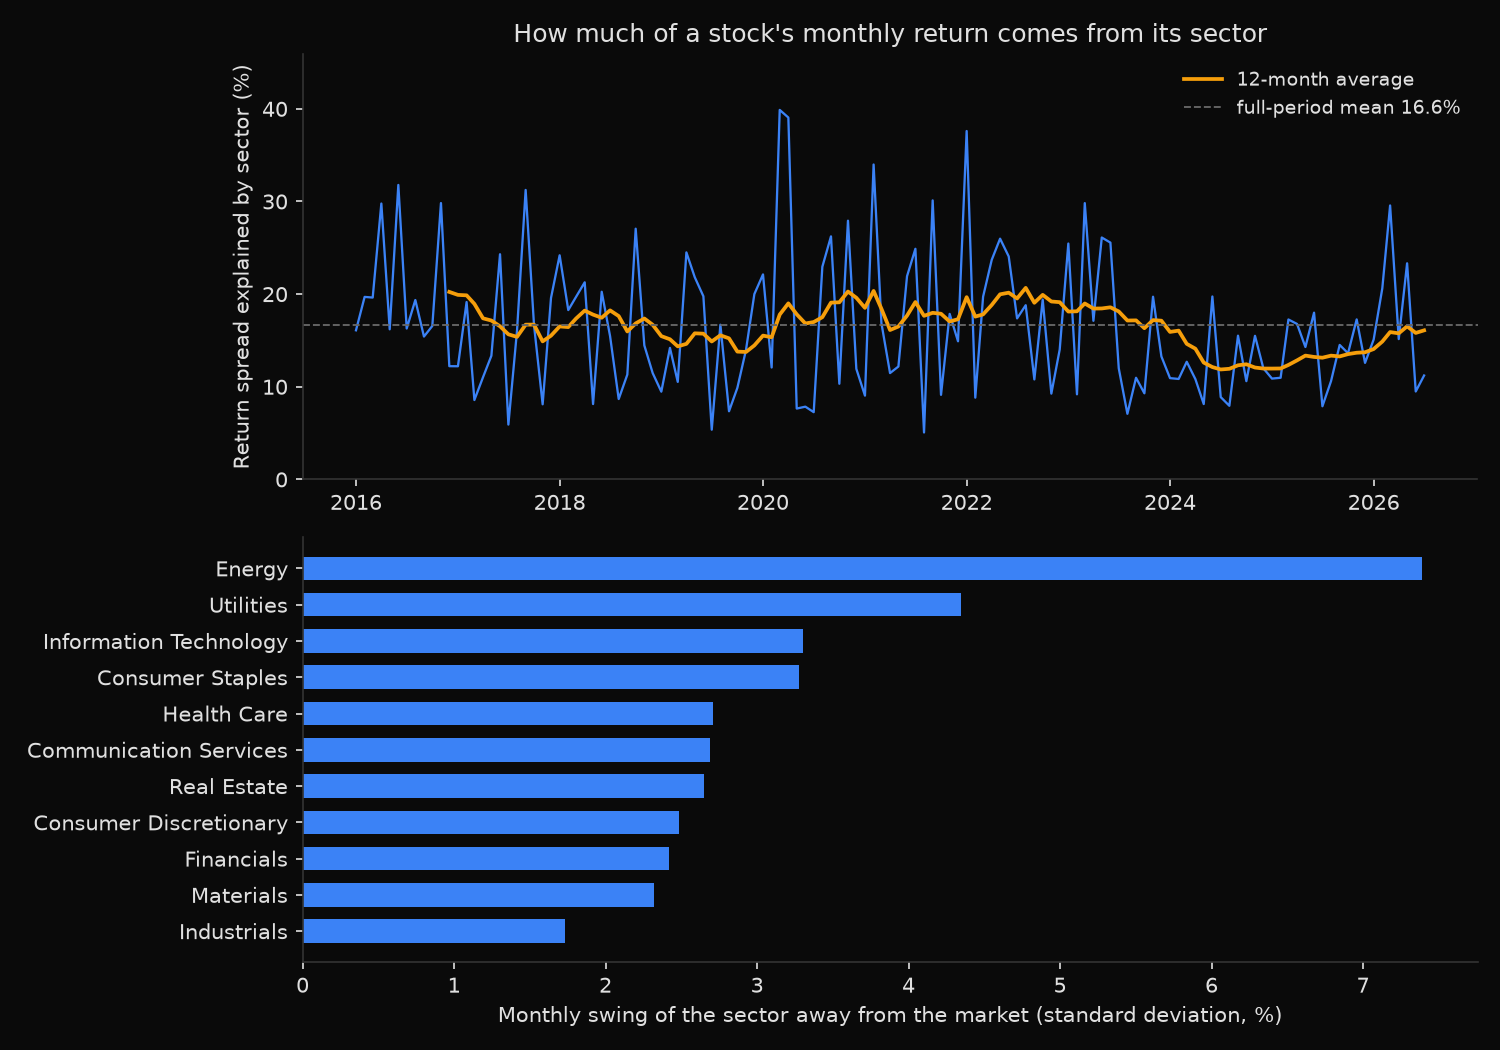
  mean 16.6%   median 15.5%   min 5.1%   max 39.9%
  highest months:
    2020-03   39.9%   market  -19.1%
    2020-04   39.1%   market  +14.2%
    2022-01   37.6%   market   -4.4%
    2021-02   34.0%   market   +5.9%
    2016-06   31.8%   market   -0.1%
  lowest months:
    2021-08    5.1%   market   +2.0%
    2019-07    5.4%   market   +0.7%
    2017-07    5.9%   market   +1.5%

sector effect: monthly deviation of a sector from the market, %
sector                    std dev    mean    best   worst
Energy                       7.39    0.22    25.8   -26.5
Utilities                    4.35   -0.18     9.2   -14.1
Information Technology       3.30    0.69    16.2    -5.6
Consumer Staples             3.28   -0.54    12.6    -7.8
Health Care                  2.71   -0.15    12.0    -8.2
Communication Services       2.69   -0.41     6.0    -7.3
Real Estate                  2.65   -0.50     6.6    -7.2
Consumer Discretionary       2.49   -0.10     7.8   -12.6
Financials                   2.42    0.10     6.9    -9.9
Materials                    2.32   -0.10     6.3    -5.0
Industrials                  1.73    0.25     5.6    -4.6
What this tells us
Across 127 months, stock-specific movement accounted for 57.3% of the variance in a member’s monthly return, the market for 29.6%, and the sector for 13.1%. Company risk is more than four times sector risk, and the 0.5% clip returns 58.4%, 28.6% and 13.0%, so the ranking does not turn on how the tails are handled.
Standard deviations show how little a hedge buys. The typical member moved 8.82% in a month; hedging out the market brings that to 7.40%, and adding a sector hedge to 6.67%. Roughly three quarters of the original volatility survives both.
The average is the least useful number in the table. Sector share of the cross-section runs from 5.1% to 39.9%, and the five highest months are dated events rather than quiet drift. In March 2020 energy members fell 45.6% against a market of -19.1% while consumer staples fell 6.5%. In January 2022, as rate expectations reset, energy gained 17.6% while information technology lost 10.0%. June 2016 produced a flat market and a 13.5-point gap between utilities and financials.
Energy sits apart from every other label, its monthly deviation carrying a standard deviation of 7.39 points against 4.35 for utilities and 1.73 for industrials. That is a statement about the label as much as the commodity: energy holds 21 companies exposed to one price, while industrials holds 77 whose fortunes have little to do with each other, so the industrials average tracks the market by construction.
So what?
Treat sector neutrality as a way to control which bets a book expresses, not as a way to reduce its risk. Market and sector hedges together remove about a quarter of the volatility of a typical S&P 500 name; the rest is company risk, and the only instrument that reduces it is holding more names. A twelve-position sector-neutral book remains a concentrated bet however evenly the labels are spread.
Size sector exposure to the regime rather than to the long-run average. The sector share moves by a factor of eight between quiet months and rotations, and rotations cluster around identifiable events: a policy turn, an oil shock, a vaccine result. Tilts that are tolerable in a 6% month are a different proposition in a 38% one.
For pairs and relative-value work, the sector match is a starting filter and nothing more. Two companies in one sector share the 13.1% the label carries; the 57.3% that separates them is what the trade is exposed to. Energy is the exception, because a single 25-point sector move will overwhelm most views about two companies inside it.
Built with xfinlink — free financial data API for Python. pip install -U xfinlink
pip install -U xfinlink