
Is the AI Capex Trade Crowded? Rolling Volatility and Sector Rotation in Python
June 1, 2026
What’s the question?
An investment theme becomes fragile when many stocks begin responding to the same risk factor. In AI infrastructure, that factor is the capex race: each large company spends because falling behind may be strategically worse than overspending. This has a game-theory structure. If every firm believes that others will spend, each firm has an incentive to keep spending even when the industry-level return on investment is uncertain.
For public markets, the question is whether the stocks are trading like a crowded basket. Crowding can be observed through two market variables. Volatility measures how much the basket is moving. Pairwise correlation measures whether the stocks are moving together. High volatility and high correlation together are more dangerous than high volatility alone.
The approach
The AI basket is MSFT, AMZN, META, GOOG, ORCL, NVDA, and AVGO. Sector alternatives are represented by equal-weight baskets of large stocks in staples, healthcare, utilities, energy, financials, and industrials. Built from SEC EDGAR public filings and market data, the test uses three years of daily prices.
- Build daily returns from
adj_close, the split-adjusted closing price field - Calculate a 60-day rolling annualized volatility series for the AI basket
- Calculate a 60-day rolling average pairwise correlation among AI basket stocks
- Compare each sector basket's full-period and latest 60-day correlation with the AI basket
This does not predict a crash. It identifies which sectors currently diversify the AI capex factor.
Code
import xfinlink as xfl

xfl.set_api_key("YOUR_API_KEY")  # free at https://xfinlink.com/signup

ai = ["MSFT", "AMZN", "META", "GOOG", "ORCL", "NVDA", "AVGO"]
sectors = {
    "Staples": ["PG", "KO", "WMT"],
    "Healthcare": ["JNJ", "UNH", "MRK"],
    "Utilities": ["NEE", "DUK", "SO"],
    "Energy": ["XOM", "CVX", "COP"],
    "Financials": ["JPM", "BAC", "GS"],
    "Industrials": ["CAT", "HON", "GE"],
}

tickers = ai + [ticker for group in sectors.values() for ticker in group]
prices = xfl.prices(tickers, period="3y", fields=["adj_close"])
adjusted = prices.pivot_table(index="date", columns="ticker", values="adj_close").dropna(subset=tickers)
returns = adjusted[tickers].pct_change().dropna()
returns["AI basket"] = returns[ai].mean(axis=1)

latest_sector_corr = {
    name: returns[group].mean(axis=1).iloc[-60:].corr(returns["AI basket"].iloc[-60:])
    for name, group in sectors.items()
}
print(latest_sector_corr)
Full script with formatting and visualisation: ai-capex-crowding-sector-rotation-python.py
Output
=== AI Capex Crowding and Sector Rotation ===
Sample: 2023-06-06 to 2026-06-02 (749 trading days)
Rolling window: 60 trading days
Latest AI basket volatility: 26.7%
Median AI basket volatility: 24.7%
Volatility percentile: 70%
Latest AI pairwise correlation: 0.353
Median AI pairwise correlation: 0.431
Correlation percentile: 25%
Sector basket correlation to AI basket:
Energy full_period=+0.071 latest_60d=-0.463
Utilities full_period=-0.150 latest_60d=-0.239
Staples full_period=-0.041 latest_60d=+0.009
Healthcare full_period=-0.065 latest_60d=+0.124
Industrials full_period=+0.503 latest_60d=+0.427
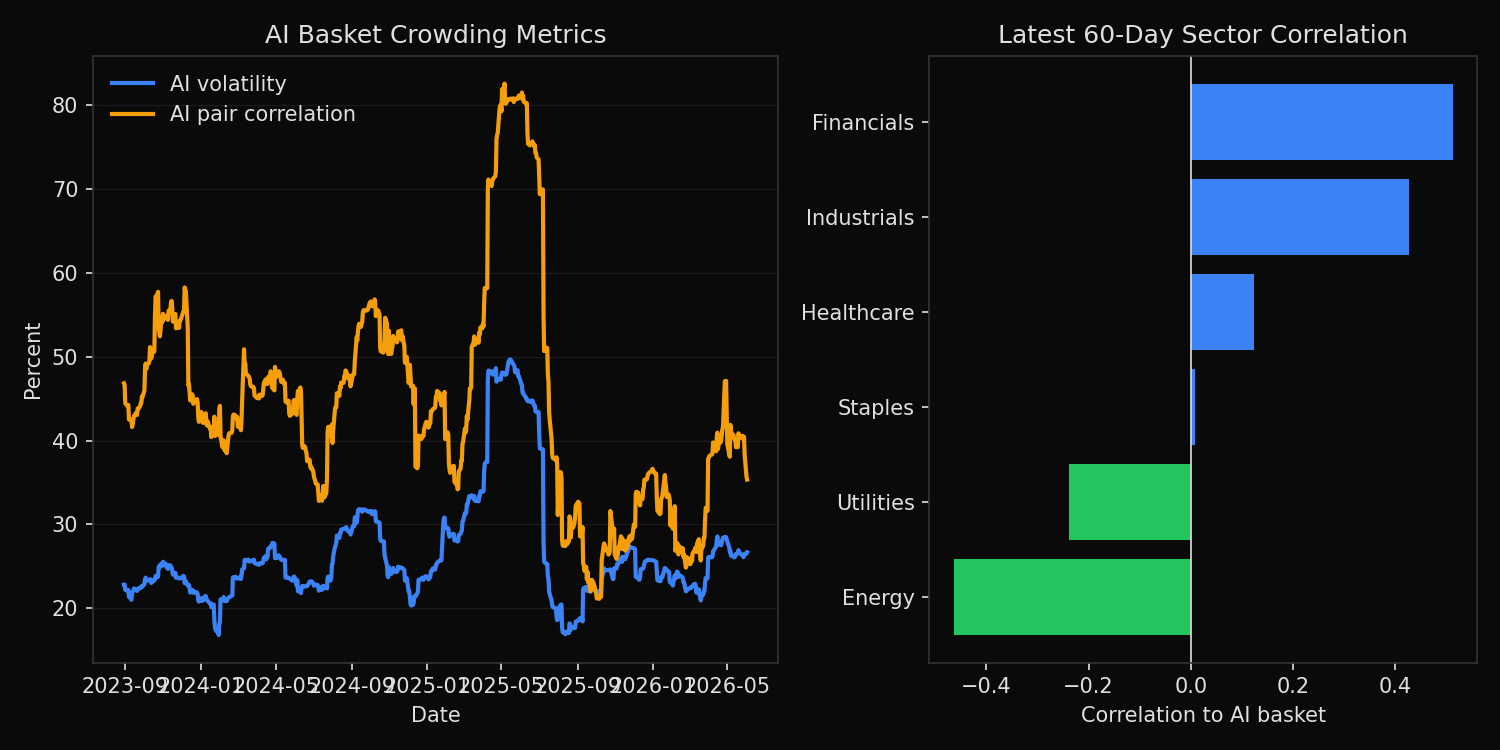
Financials full_period=+0.428 latest_60d=+0.513What this tells us
The AI basket is volatile, but the crowding signal is not extreme. Latest 60-day annualized volatility is 26.7%, above the three-year median of 24.7% and in the 70th percentile. That says the basket is in a higher-volatility regime.
The pairwise correlation result is more nuanced. The latest average AI pairwise correlation is 0.353, below the median of 0.431 and in only the 25th percentile. The stocks are moving more than usual, but they are not all moving together more than usual. That weakens the argument that the trade is already in a uniform liquidation regime.
Sector correlations identify the practical hedges. Energy has a latest 60-day correlation of -0.463 to the AI basket. Utilities are also negative at -0.239. Financials and industrials are poor diversifiers in this sample, with latest correlations of +0.513 and +0.427.
So what?
The current evidence supports hedging AI exposure through sector rotation rather than abandoning the theme outright. High volatility means position sizing should be conservative. Lower-than-median pairwise correlation means the basket is not yet behaving like a single forced trade.
For portfolio construction, energy and utilities are the more useful offsets in the latest 60-day window. Staples and healthcare provide milder diversification. Financials and industrials should not be treated as independent hedges for AI capex risk when their correlations are positive and rising.
Built with xfinlink — free financial data API for Python. pip install xfinlink
pip install xfinlink