
Does Fast Revenue Growth Force Companies to Borrow? Cash Funding Analysis in Python
August 12, 2026
What’s the question?
Growth is supposed to be expensive. Selling more requires more inventory, more receivables outstanding while customers pay, and more capacity to produce with. The textbook conclusion follows: a company growing at 20% a year outruns its own cash generation and closes the gap with debt or new shares. Credit analysts run the logic in reverse and treat rapid growth as a warning that leverage is about to rise.
Filings settle it: over any multi-year window a company either paid for its own reinvestment and dividend out of operating cash flow, or it did not.
Define the measure used here as cash kept: five years of operating cash flow, less capital expenditure, less common dividends, divided by the revenue booked over those same years. Positive means the business funded both internally. Negative means the money came from somewhere else, and the change in total debt across the window says how much of it was borrowed.
The approach
The sample is fixed at the start of the window. Drawing it from today’s index would select the companies that grew well enough to still be there.
- Take the S&P 500 roster as it stood on 31 December 2019, keyed on entity identifiers rather than symbols, so a company that later changed its ticker remains one company across the panel.
- Pull annual filings for fiscal 2019 through fiscal 2024. Where a 52 or 53-week filer closes two periods under one fiscal-year label, keep the later close, so every company contributes one row per year.
- Drop Financials and Real Estate, since capital expenditure and operating cash flow do not describe how a bank or a REIT funds itself.
- Require a complete six-year record of revenue, operating cash flow, capital expenditure and total debt, counting only years in which operating cash flow does not exceed revenue, a level no non-financial business sustains. 341 companies qualify, giving 2,046 company-years.
- Rank them into quintiles by five-year revenue growth, then compare median cash kept, median debt added and the share running an outright deficit.
Scaling by cumulative revenue puts a utility and a software company on one axis, and Spearman rank correlations show whether the pattern depends on where the quintile boundaries fall.
Code
import pandas as pd
from scipy import stats
import xfinlink as xfl

xfl.set_api_key("YOUR_API_KEY")  # free at https://xfinlink.com/signup

FIELDS = ["revenue", "operating_cash_flow", "capital_expenditures",
          "dividends_paid_common", "share_repurchases", "total_debt", "gics_sector"]

roster = xfl.index("sp500", as_of="2019-12-31").drop_duplicates("entity_id")
ids = sorted(int(e) for e in roster["entity_id"].dropna())
df = pd.concat([xfl.fundamentals(entity_id=ids[i:i + 50], period_type="annual",
                                 start="2018-06-01", end="2025-12-31", fields=FIELDS)
                for i in range(0, len(ids), 50)], ignore_index=True)

df = df.sort_values(["entity_id", "fiscal_year", "period_end"])
df = df.drop_duplicates(["entity_id", "fiscal_year"], keep="last")

panel = df[df["fiscal_year"].between(2019, 2024)].copy()
panel = panel[~panel["gics_sector"].isin(["Financials", "Real Estate"])]
panel["dividends_paid_common"] = panel["dividends_paid_common"].fillna(0.0)
panel = panel.dropna(subset=["revenue", "operating_cash_flow",
                             "capital_expenditures", "total_debt"])
panel = panel[panel["operating_cash_flow"] <= panel["revenue"]]
years = panel.groupby("entity_id")["fiscal_year"].nunique()
panel = panel[panel["entity_id"].isin(years[years == 6].index)]

flows = panel[panel["fiscal_year"] > 2019]
firms = flows.groupby("entity_id").agg(
    cum_revenue=("revenue", "sum"), cum_ocf=("operating_cash_flow", "sum"),
    cum_capex=("capital_expenditures", "sum"),
    cum_dividends=("dividends_paid_common", "sum"))
first = panel[panel["fiscal_year"] == 2019].set_index("entity_id")
last = panel[panel["fiscal_year"] == 2024].set_index("entity_id")

firms["cagr"] = (last["revenue"] / first["revenue"]) ** (1 / 5) - 1
firms["retained"] = ((firms["cum_ocf"] - firms["cum_capex"] - firms["cum_dividends"])
                     / firms["cum_revenue"] * 100)
firms["borrowed"] = (last["total_debt"] - first["total_debt"]) / firms["cum_revenue"] * 100

firms["quintile"] = pd.qcut(firms["cagr"], 5, labels=[1, 2, 3, 4, 5])
print(firms.groupby("quintile").agg(
    cagr=("cagr", "median"), retained=("retained", "median"),
    borrowed=("borrowed", "median"),
    deficit=("retained", lambda s: (s < 0).mean() * 100)))
print(stats.spearmanr(firms["cagr"], firms["borrowed"]))
Full script with formatting and visualisation: does-revenue-growth-require-borrowing-python.py
Output
==========================================================================
DOES FAST REVENUE GROWTH FORCE A COMPANY TO BORROW?
S&P 500 roster at 31 Dec 2019, fiscal 2019-2024, ex Financials and Real Estate
==========================================================================
entities on the point-in-time roster               500
complete six-year records in scope                 341
company-years                                     2046

MEDIANS BY REVENUE GROWTH QUINTILE, PERCENT OF FIVE-YEAR REVENUE
quintile    companies   rev CAGR   cash kept   debt added   buybacks   in deficit
Q1                 69      -1.1%        4.8%         0.4%       3.4%        17.4%
Q2                 68       3.0%        6.0%         0.8%       3.4%        17.6%
Q3                 68       5.1%        5.3%         1.9%       2.6%        17.6%
Q4                 68       7.6%        6.9%         1.9%       3.8%        16.2%
Q5                 68      13.6%       10.4%         2.1%       5.5%         4.4%

RANK CORRELATION WITH REVENUE GROWTH
cash kept    all companies rho +0.243 (p=0.0000)   within sector rho +0.127 (p=0.0191)
debt added   all companies rho +0.183 (p=0.0007)   within sector rho +0.266 (p=0.0000)

ROBUSTNESS: SAME TABLE WITHOUT THE 20 LARGEST BY REVENUE
Q1                 65      -1.3%        4.7%         0.4%       3.4%        16.9%
Q2                 64       2.7%        6.4%         0.4%       3.3%        20.3%
Q3                 64       4.9%        5.5%         2.1%       3.5%        15.6%
Q4                 64       7.3%        6.9%         2.2%       3.8%        20.3%
Q5                 64      13.1%       10.9%         2.4%       6.7%         4.7%

BY SECTOR, MEDIANS
sector                      companies   rev CAGR   cash kept   debt added
Utilities                          28       4.0%      -19.0%        14.5%
Consumer Discretionary             49       6.0%        5.2%         1.9%
Information Technology             53       6.5%       15.4%         1.9%
Industrials                        62       5.2%        6.0%         1.2%
Materials                          26       4.3%        5.5%         0.9%
Health Care                        49       7.7%       10.9%         0.8%
Communication Services             17       3.8%        6.8%         0.7%
Consumer Staples                   34       4.7%        4.1%         0.3%
Energy                             23       6.4%        5.1%         0.1%

FASTEST-GROWING QUINTILE, COMPANIES THAT STILL RAN A CASH DEFICIT
FANG  Energy                  growth  23.3%   cash kept  -12.3%   debt added  19.6%
IFF   Materials               growth  17.4%   cash kept   -0.3%   debt added   6.1%
OKE   Energy                  growth  16.4%   cash kept   -0.2%   debt added  21.1%
What this tells us
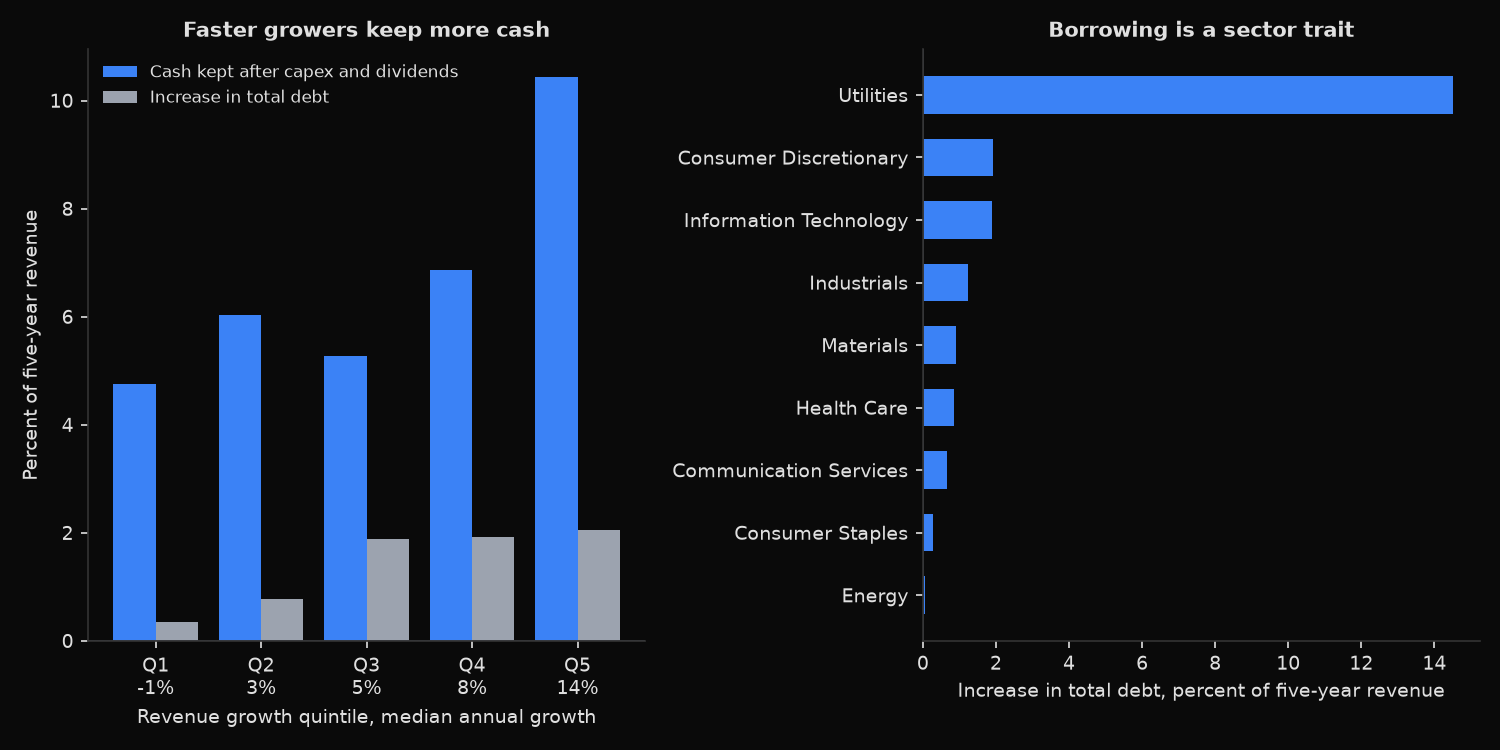
The relationship runs the opposite way to the textbook. The fastest-growing quintile, compounding revenue at a median 13.6% a year, kept 10.4% of five years of revenue after capital expenditure and dividends, against 4.8% for the slowest quintile, whose median company shrank. A rank correlation of +0.243 says cash generation rises with growth across the whole distribution, not only at the extremes.
The deficit counts are sharper. Twelve of the 69 slowest growers, 17.4%, spent more than they generated over the five years. Among the 68 fastest growers, three did.
Debt is subtler. The median company in the top quintile did add debt worth 2.1% of five-year revenue against 0.4% in the bottom quintile, and within sectors the rank correlation between growth and borrowing rises to +0.266, so fast growers do borrow somewhat more. Those amounts are small next to the spread across sectors, where the median utility added 14.5% and the median energy company 0.1%.
Utilities are the whole external-funding story. Median cash kept is negative 19.0% at a median growth rate of 4.0%, because rate-base capital expenditure plus a dividend the sector protects came to more than operating cash flow. Information technology kept 15.4% on growth of 6.5%. A gap of 34 points in funding need sits on a gap of 2.5 points in growth.
Removing the 20 largest companies by revenue changes little: top-quintile cash kept moves to 10.9% and bottom-quintile to 4.7%. Mega-caps are not driving the result.
So what?
Growth rate is a poor input to a leverage forecast, and screens that treat it as one flag the wrong names. Use cash kept instead, computed over several years rather than one: below zero, the company had to raise money to stand still whatever its growth rate. On the sector medians that test isolates the utilities and leaves the growth ranking silent.
The exceptions matter because they are rare. Diamondback Energy and ONEOK grew revenue at 23.3% and 16.4% a year while consuming cash and adding debt worth roughly a fifth of five-year revenue, the signature of growth bought rather than earned. That is a different security to underwrite than organic growth of the same headline rate, and a revenue chart will not tell the two apart. One call to the fundamentals endpoint separates them in a single column.
Built with xfinlink — free financial data API for Python. pip install -U xfinlink
pip install -U xfinlink