
How Long Does a Stock Take to Recover From a 50% Fall? Drawdown Analysis in Python
August 10, 2026
What’s the question?
A drawdown is the fall from a running high to a later low, and its recovery is the month the price first closes back above that old high. Index history makes both look survivable: the S&P 500 has recovered every fall it ever suffered, and the worst took close to seven years.
Individual stocks are a different problem, for a mechanical reason. An index is a portfolio with a maintenance rule, so companies that fail get removed and replaced; it recovers partly because its failures are deleted from it, while the shareholder who owned the failure keeps the loss. Two numbers decide what a 50% fall in one company costs: the wait when the price does come back, and how often it never comes back.
The approach
A study built on today’s index members would measure the recovery record of companies selected for having recovered.
- Take the S&P 500 roster as it stood at each year end from 1995 to 2025, plus July 2026. The union is 1,133 companies, keyed on a persistent company identifier rather than a ticker string, so a symbol reused by a later listing cannot contaminate an earlier one.
- Pull monthly split-adjusted closes from January 1996 to July 2026. A raw close steps across every split and would manufacture falls that never happened.
- Track each company from the month it joined the index, and stop its series where trading stops. A company delisted in 2009 has a series that ends in 2009.
- Cut every series into episodes: from a running high, to the lowest point before that high is regained, to the month the price closes back above it. Falls shallower than 20% are ignored.
- Handle censoring. A stock that hit its low in 2024 cannot be watched for five years, so it drops from the five-year figure rather than counting as a failure, while a company that stopped trading below its old high counts as a failure at every horizon.
Series without a clean single-symbol monthly record for the window drop out, leaving 871 companies, 524 of them still trading in July 2026. Prices are adjusted for splits and not for spin-offs, so a company that handed a large division to its own shareholders registers a fall its holders did not suffer, which makes the figures conservative.
Code
import numpy as np
import pandas as pd
import xfinlink as xfl

xfl.set_api_key("YOUR_API_KEY")  # free at https://xfinlink.com/signup

roster = pd.concat([xfl.index("sp500", as_of=d)[["entity_id", "added_date"]]
                    for d in [f"{y}-12-31" for y in range(1995, 2026)] + ["2026-07-31"]])
joined = pd.to_datetime(roster.groupby("entity_id")["added_date"].min()).dt.to_period("M")
ids = sorted(joined.index)

frames = []
for i in range(0, len(ids), 40):
    frames.append(xfl.prices(entity_id=ids[i:i + 40], start="1996-01-01",
                             end="2026-07-31", interval="1mo",
                             fields=["adj_close"], max_rows=500000))
px = pd.concat(frames, ignore_index=True)
px["m"] = pd.to_datetime(px["date"]).dt.to_period("M")
px = px[px["m"] >= px["entity_id"].map(joined)].sort_values(["entity_id", "m"])

def episodes(values):
    out, peak, pi, low, li, live = [], values[0], 0, values[0], 0, False
    for i in range(1, len(values)):
        x = values[i]
        if x >= peak:
            if live:
                out.append((pi, li, i, 1 - low / peak))
                live = False
            peak, pi, low, li = x, i, x, i
        elif not live:
            live, low, li = True, x, i
        elif x < low:
            low, li = x, i
    if live:
        out.append((pi, li, None, 1 - low / peak))
    return out

def share_back(frame, h):
    hit = frame["recovered"] & (frame["months"] <= h)
    countable = hit | ~frame["trading"] | (frame["watched"] >= h)
    return hit.sum() / countable.sum() * 100
Full script with formatting and visualisation: how-long-do-stock-drawdowns-take-to-recover-python.py
Output
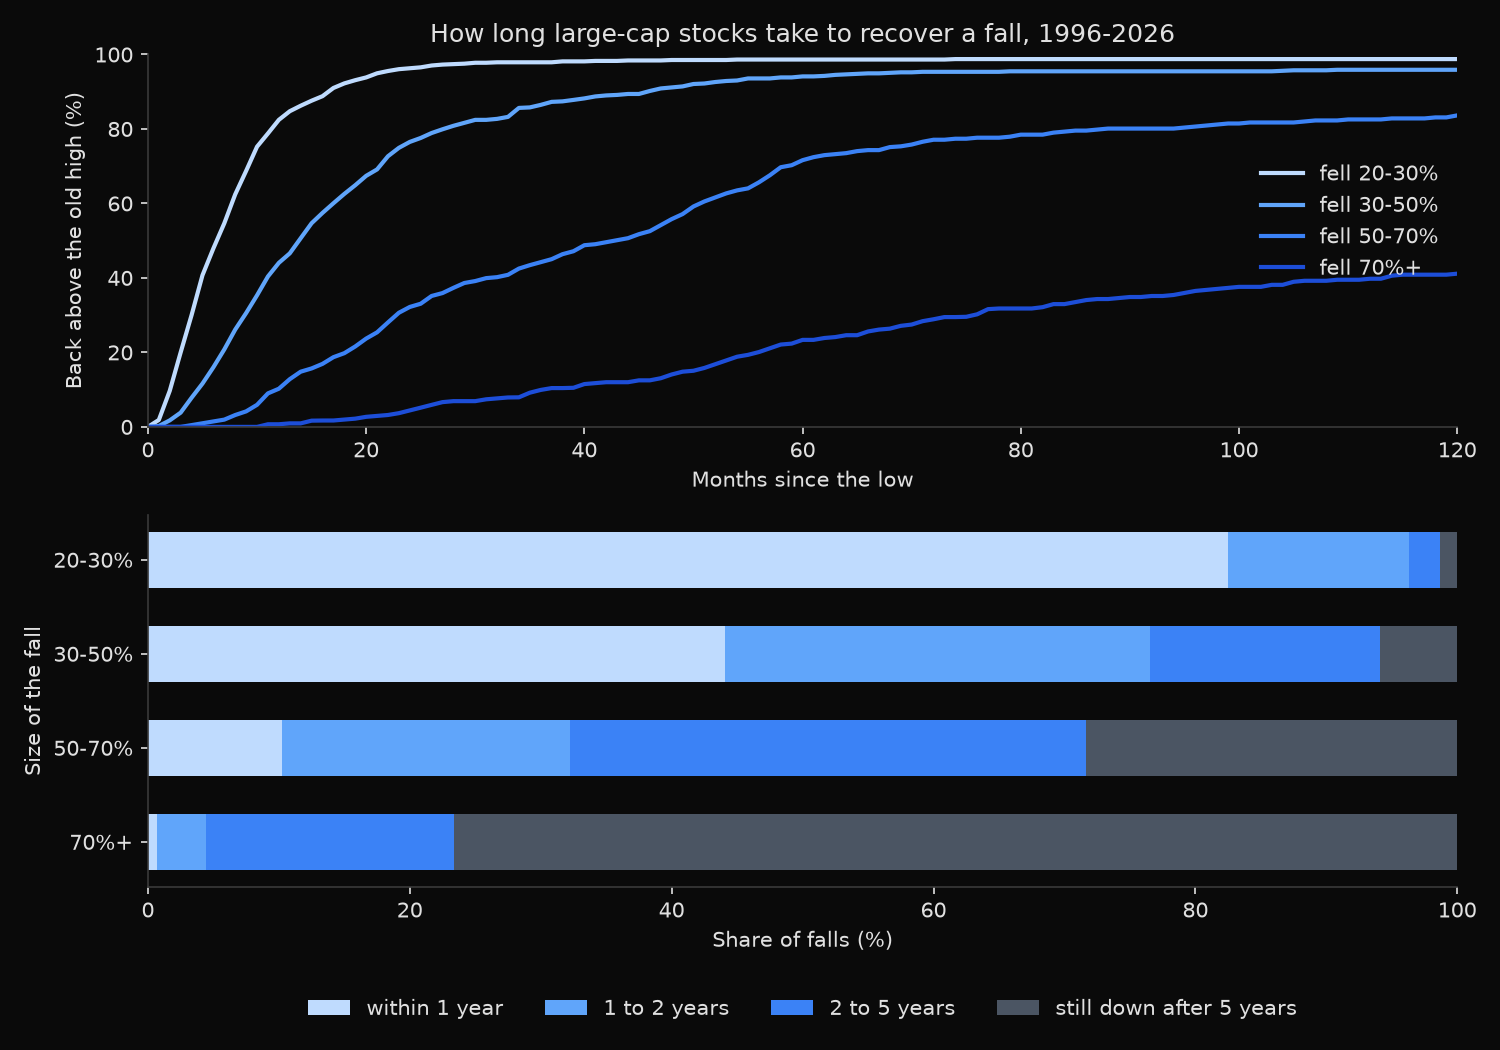
point-in-time S&P 500 rosters, 32 dates 1995-2026: 1133 distinct companies
monthly split-adjusted closes 1996-01 to 2026-07: 271,842 bars on 1047 companies
each series starts the month the company joined the index: 198,464 bars
52 companies truncated at a break in trading
set aside: 41 where a symbol reappears after another, 36 with a price step above 50% at a symbol change,
           39 with a single month beyond +200% or -90%, 117 with under 36 months
sample: 871 companies, 174,859 monthly bars, 524 still trading at 2026-07

falls of 20% or deeper from a running high: 2,611 episodes on 868 companies

fall      episodes   within 1yr    within 2yr    within 5yr   median  never
20-30%         872   82.5% ( 815)   96.3% ( 812)   98.6% ( 812)       7   8.0%
30-50%         826   44.1% ( 765)   76.5% ( 754)   94.1% ( 731)      13  14.9%
50-70%         449   10.2% ( 400)   32.2% ( 385)   71.6% ( 370)      34  29.6%
70%+           464    0.7% ( 424)    4.4% ( 407)   23.4% ( 398)      61  59.9%
counts in brackets are the episodes countable at that horizon; median months is measured from the low, over recoveries only

where every episode stands at 2026-07
fall      episodes   back above the old high   below it, still trading   series ends first
20-30%         872         802 (92.0%)                60 ( 6.9%)             10 ( 1.1%)
30-50%         826         703 (85.1%)                95 (11.5%)             28 ( 3.4%)
50-70%         449         316 (70.4%)                83 (18.5%)             50 (11.1%)
70%+           464         186 (40.1%)               121 (26.1%)            157 (33.8%)

falls of 50% or more: 913 episodes on 653 companies
  back above the old high within  1 year :   5.3%  (44/824)
  back above the old high within  2 years:  17.9%  (142/792)
  back above the old high within  5 years:  46.6%  (358/768)
  back above the old high within 10 years:  62.4%  (458/734)
  median months from the low, over recoveries only: 47
  never got back: 411 of 913 (45.0%)

longest waits from the low back to the old high
              company  sym    peak     low    back fall % months
          CORNING INC  GLW 2000-08 2002-07 2026-02   98.5  283.0
    CISCO SYSTEMS INC CSCO 2000-03 2002-09 2026-01   86.4  280.0
           NETAPP INC NTAP 2000-09 2001-09 2024-06   94.7  273.0
         QUALCOMM INC QCOM 1999-12 2002-07 2019-12   84.4  209.0
           INTEL CORP INTC 2000-08 2009-02 2026-04   83.0  206.0
 BANK OF AMERICA CORP  BAC 2006-10 2009-02 2025-12   92.7  202.0
TENET HEALTHCARE CORP  THC 2002-05 2009-01 2025-09   97.8  200.0
           CIENA CORP CIEN 2001-11 2009-02 2025-09   95.7  199.0

deepest falls on companies whose price series ends before recovery
                      company  sym    peak     low fall % last month
                RITE AID CORP  RAD 1998-12 2023-09  100.0    2023-10
    FLEETWOOD ENTERPRISES INC  FLE 1998-02 2009-01   99.9    2009-01
         CONEXANT SYSTEMS INC CNXT 2000-02 2009-02   99.9    2011-04
FRONTIER COMMUNICATIONS PRINT  FTR 2007-05 2020-04   99.9    2020-04
                 VISTEON CORP   VC 2001-07 2009-03   99.9    2009-03
          PEABODY ENERGY CORP  BTU 2008-06 2016-04   99.9    2016-04
       CHESAPEAKE ENERGY CORP  CHK 2008-06 2020-06   99.9    2020-06
            PENNEY J C CO INC  JCP 2007-03 2020-05   99.8    2020-05
What this tells us
Depth does not scale the wait, it changes the outcome. A fall of 20% to 30% is a routine interruption: 82.5% are over within a year, the median takes 7 months from the low, and 8.0% have not recovered. A fall of 50% or more sits elsewhere entirely, with 5.3% back inside a year, 46.6% inside five, and 45.0% of those 913 episodes never getting back.
The break comes between the 30-50% bucket and the 50-70% bucket. One-year recovery drops from 44.1% to 10.2% and the median wait from the low goes from 13 months to 34. Halving is not twice as bad as a quarter fall; it is a different kind of event, because a price that has halved usually reflects a change in what the business is worth rather than in what the market will pay for it.
Below 70% the arithmetic turns hostile, since regaining the old high then requires a 233% gain. Of the 464 falls that deep, 157 belong to companies whose price series ends first, the polite description of Rite Aid, Chesapeake Energy and the rest of that table; another 121 are still under water and trading. The 61-month median here covers only the 40.1% that made it back, so it understates the wait facing a holder at the low.
Recoveries that do arrive can take decades. Corning regained its August 2000 high in February 2026, 283 months after the 2002 low; Cisco needed 280 months and Bank of America 202, each of them large and continuously listed for the whole wait.
So what?
Size single positions against the tail rather than the average. A position that halves has a 45% historical chance of never returning to its old high, and a median wait near four years if it does. Depth is the strongest cheap signal about what follows, and it argues for cutting deep losers instead of averaging into them.
Index recovery statistics do not transfer to single names. The S&P 500 regained its August 2000 high in May 2007, 81 months later, because it dropped the companies that did not; Corning, Cisco and Intel, index members throughout, needed between 17 and 24 years from their lows.
For a tail-risk model, the split between the two failure modes matters more than the headline rate. Among 70%-plus falls, 33.8% ended with the series ending, a default-like outcome that belongs in a credit-shaped model, and 26.1% are still open, which is a live position with option value. Running this on a specific universe takes one roster pull and one price pull, and returns depth-conditional recovery odds for the book actually held.
Built with xfinlink — free financial data API for Python. pip install -U xfinlink
pip install -U xfinlink