
Are One-Time Charges Really One-Time? Charge Frequency Analysis in Python
August 11, 2026
What’s the question?
Restructuring charges and asset impairments arrive with a story attached. The company separates them on the income statement, the earnings release presents an adjusted figure with the charge removed, and the implied claim is that the ongoing business does not carry this cost. Most models accept the claim and forecast from the adjusted base.
That treatment is reasonable when the charge really does happen once: a plant closes, severance and write-downs land in a single year, and the following years are clean. It stops being reasonable when the same company announces a fresh exceptional charge every year, because a cost that recurs annually is not exceptional. It is an operating expense wearing a different label, and removing it inflates every multiple built on that base.
Whether the label survives contact with the filings is a question about frequency. Across a business cycle, in how many years does a large American company report a material restructuring or impairment charge?
The approach
The test needs a fixed group of companies followed for long enough that a genuinely rare event has room to be rare.
- Take the S&P 500 roster as it stood on 31 December 2014, keyed on entity identifiers rather than symbols so a company that later changed its ticker stays the same company. Membership is point-in-time, so the sample is the index as it was, not the survivors as they are now.
- Pull annual filings for fiscal 2015 through fiscal 2023. Companies with a complete nine-year record of revenue and operating income enter the sample; 382 qualify, giving 3,438 company-years.
- For each year take the larger of the reported restructuring charge and the reported asset impairment, not the sum, because some filers present one combined figure under both labels and adding them would count it twice.
- Count a charge year when the charge exceeds 0.5% of that year’s revenue. Without a floor, trivial amounts make every company look like a serial restructurer.
- Measure the cost as cumulative charges divided by cumulative operating income before those charges: the share of nine years of profit that never reached shareholders.
Code
import numpy as np
import pandas as pd
import xfinlink as xfl

xfl.set_api_key("YOUR_API_KEY")  # free at https://xfinlink.com/signup

FIELDS = ["restructuring_charges", "impairment_charges", "operating_income", "revenue"]

roster = xfl.index("sp500", as_of="2014-12-31").drop_duplicates("entity_id")
ids = sorted(int(e) for e in roster["entity_id"].dropna())

frames = [xfl.fundamentals(entity_id=ids[i:i + 100], period_type="annual",
                           start="2014-06-01", end="2024-06-30", fields=FIELDS)
          for i in range(0, len(ids), 100)]
df = pd.concat(frames, ignore_index=True)

df["fiscal"] = df["period_end"].dt.year - (df["period_end"].dt.month <= 5).astype(int)
df = df.sort_values("period_end").drop_duplicates(["entity_id", "fiscal"], keep="last")

panel = df[(df["fiscal"] >= 2015) & (df["fiscal"] <= 2023)]
panel = panel.dropna(subset=["revenue", "operating_income"])
panel = panel[panel["revenue"] > 0]
complete = panel.groupby("entity_id").size()
panel = panel[panel["entity_id"].isin(complete[complete == 9].index)].copy()

# The larger of the two, never the sum: some filers report one combined
# figure under both labels, and adding them would count it twice.
panel["charge"] = np.maximum(panel["restructuring_charges"].clip(lower=0).fillna(0),
                             panel["impairment_charges"].clip(lower=0).fillna(0))
panel["material"] = panel["charge"] / panel["revenue"] > 0.005

firms = panel.groupby("entity_id").agg(charge_years=("material", "sum"),
                                       total_charges=("charge", "sum"),
                                       operating_income=("operating_income", "sum"))

pre_charge = firms["operating_income"] + firms["total_charges"]
firms["drag"] = np.where(pre_charge > 0, firms["total_charges"] / pre_charge, np.nan)

charged = firms[firms["charge_years"] > 0]
print(len(firms), len(charged), charged["charge_years"].median(),
      (charged["charge_years"] >= 7).sum(), firms["drag"].median())
Full script with formatting and visualisation: are-one-time-charges-really-one-time-python.py
Output
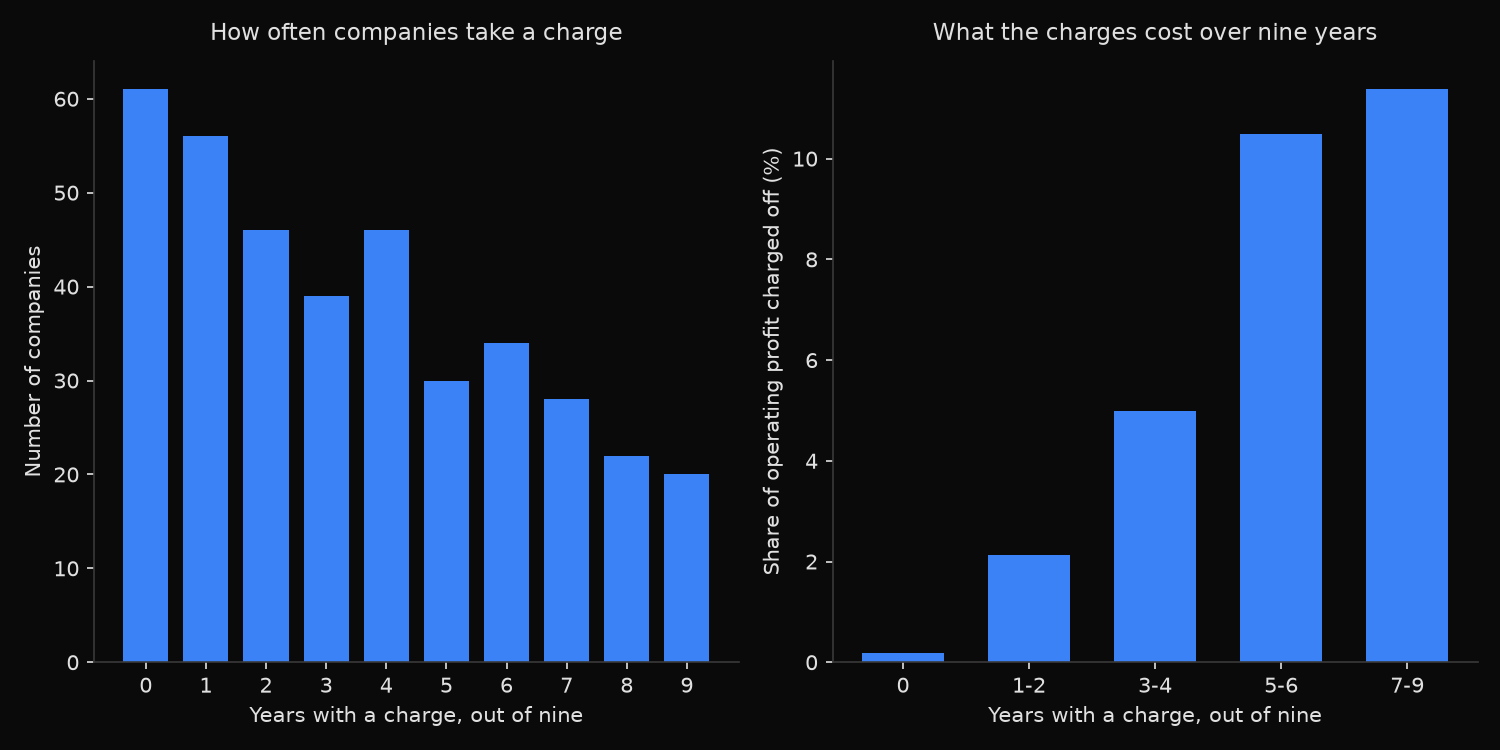
==========================================================================
HOW OFTEN DO S&P 500 COMPANIES TAKE A 'ONE-TIME' CHARGE?
Roster at 31 Dec 2014, fiscal 2015-2023, charge counted at >0.5% of revenue
==========================================================================
companies with a complete nine-year record      382
company-years                                  3438
took at least one charge                        321  (84%)
median charge years among those                   4
charged in five or more of nine years           134
charged in seven or more of nine years           70
charged in all nine years                        20

CHARGE FREQUENCY VERSUS WHAT THE CHARGES COST
years charged     companies   median cost   as % revenue
0                        61          0.2%          0.03%
1-2                     102          2.1%          0.30%
3-4                      85          5.0%          0.74%
5-6                      64         10.5%          1.35%
7-9                      70         11.4%          2.21%

BY SECTOR
sector                     companies   ever  median yrs  median cost
Energy                            31     31           6        43.3%
Utilities                         25     23           3         6.0%
Communication Services            15     14           2         5.3%
Consumer Discretionary            57     48           4         5.2%
Materials                         22     20           3         4.8%
Health Care                       42     38           4         4.7%
Real Estate                       19     15           4         4.3%
Consumer Staples                  32     21           4         4.0%
Information Technology            41     39           4         3.5%
Industrials                       53     41           2         2.5%
Financials                        45     31           3         1.8%

SENSITIVITY TO THE MATERIALITY FLOOR
floor, % of revenue     ever charged  median years  seven or more
0.5%                             321             4             70
1.0%                             277             3             26
2.0%                             207             2              7

CHARGED IN ALL NINE YEARS
PFE, EOG, GILD, NWL, MRK, AES, BAX, BKR, JCI, MDLZ, NWSA, CAG, AON, TEL,
GEN, PPL, MAT, MAC, KIM, PBI

NEVER TOOK A MATERIAL CHARGE, LARGEST BY NINE-YEAR REVENUE
WMT, AMZN, AAPL, UNH, COST, KR, HD, TGT, ADM, PEP, HUM, LMT
What this tells us
Exceptional charges are not exceptional. Of 382 companies with a complete nine-year record, 321 reported at least one charge above 0.5% of revenue, and the typical company in that group did it in four of the nine years. Seventy charged in seven years or more, and twenty charged in every single year, a list including Pfizer, Merck, Mondelez, Johnson Controls and Conagra, all of which ran rolling restructuring programmes across the period.
Frequency and cost move together, which is what separates a real one-off from a habit. Companies with one or two charge years wrote off a median 2.1% of pre-charge operating profit, while those charging in seven or more years wrote off 11.4%. Habitual restructurers are not taking smaller charges that sum to the same total; they surrender a much larger share of what they earn.
Raising the materiality floor weakens the pattern, in a direction worth knowing. At a 2% of revenue bar the median charger drops to two years of nine, and only seven companies clear it seven times. Very large charges are genuinely infrequent. The ones that repeat are big enough to be stripped out of adjusted earnings and small enough to attract no headlines.
Energy sits apart: all 31 energy companies charged at least once, the median did so in six of nine years, and the median wrote off 43.3% of pre-charge operating profit after the 2015 and 2016 oil collapse and then 2020. Financials are at the other end at 1.8%. The companies that never cleared the bar have something in common. Walmart, Amazon, Apple, UnitedHealth, Costco, Home Depot and Lockheed Martin grew without repeatedly rebuilding themselves.
So what?
Treat charge frequency as a screening variable in its own right. It costs one field and one comparison, and it splits a universe into companies whose adjusted earnings can be taken at face value and companies whose adjustments belong back in the numbers before any multiple is calculated. For a company charging in seven or more of nine years, the defensible earnings base is the reported figure.
The usable form of the correction is a nine-year average charge rate rather than a single-year add-back. A company that wrote off 11% of its operating profit through one cycle will probably do so through the next, so subtracting a normalised charge from forward operating income produces a base that history supports. This changes rankings: two companies on identical adjusted multiples separate as soon as the habitual charger is valued on what it actually earned.
The same correction applies across sectors, where a screen on adjusted operating margin sets energy companies whose write-downs consumed close to half of cycle profit against financials where the figure is under 2%.
Built with xfinlink — free financial data API for Python. pip install -U xfinlink
pip install -U xfinlink